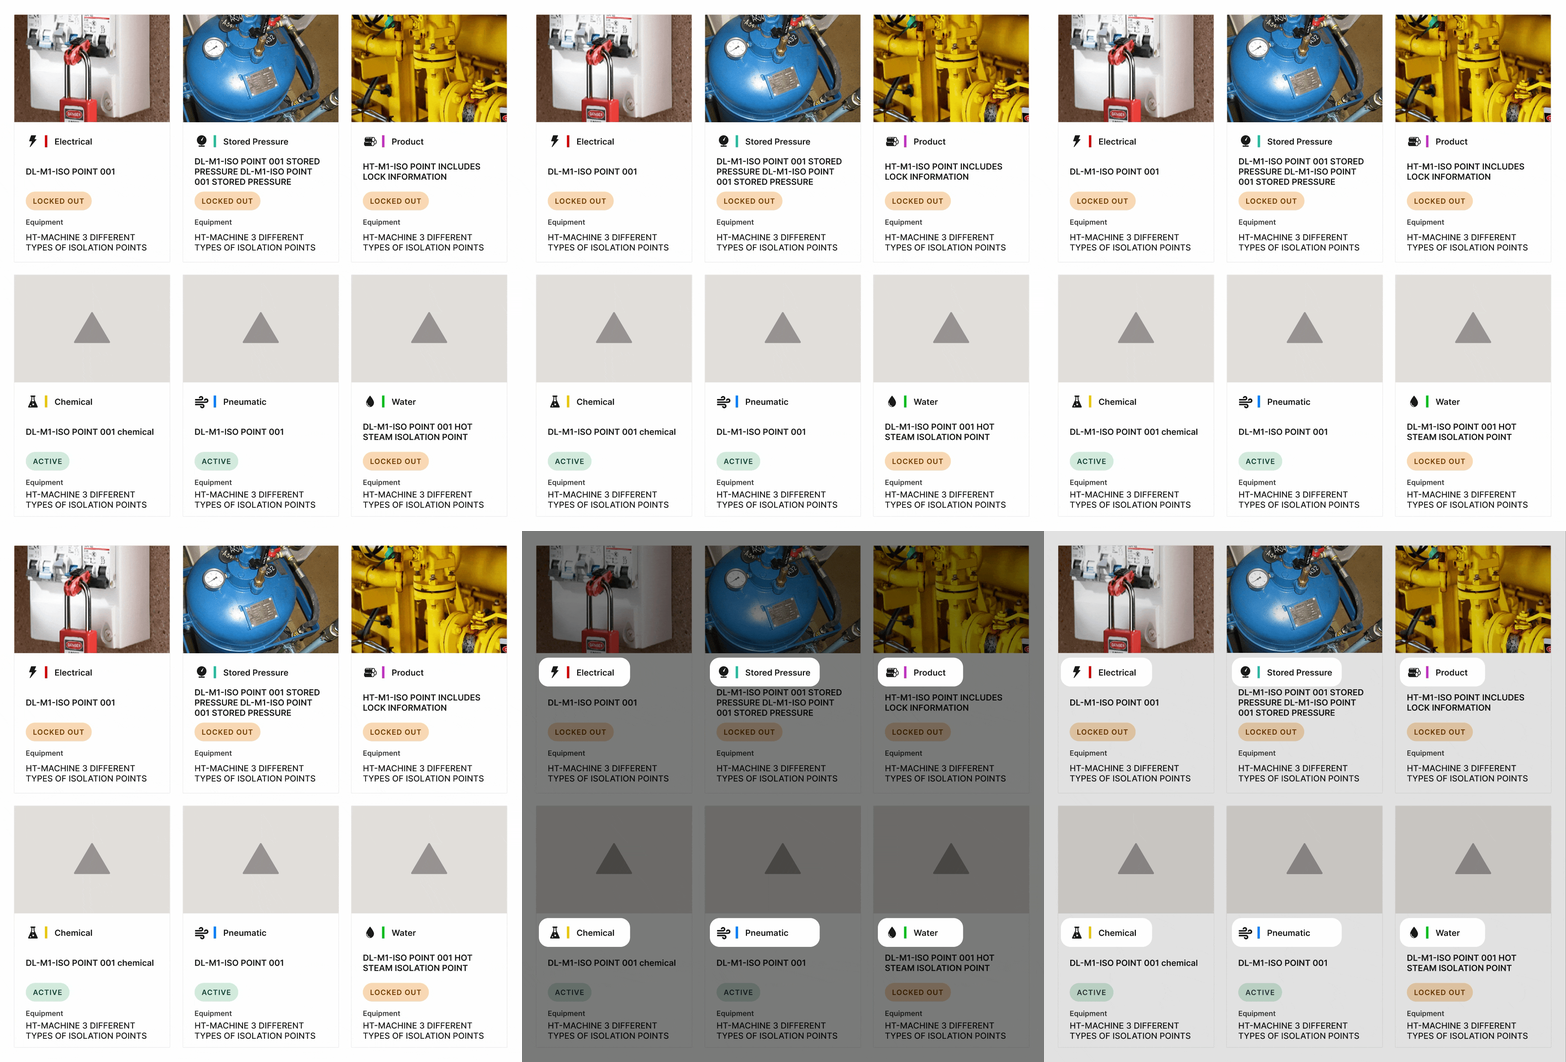
How might we make isolation point management mirror real-world field conditions while building customer confidence?

Alpha testing revealed the distinct workflows and pain points of two key user types: managers and workers.
With only 3 isolation point types, it was impossible to match them to all real-world energy sources
Low confidence identifying the right isolation point without clear visual cues
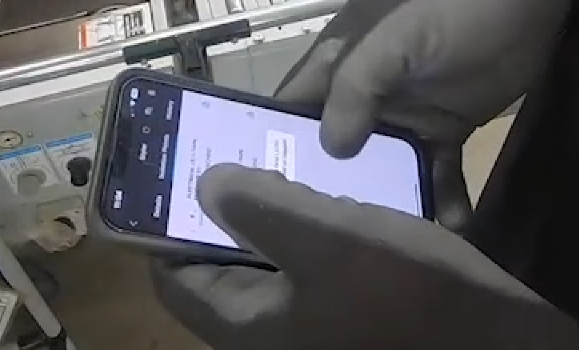
Images didn't always load in the field, making isolation points harder to identify.
Difficulty finding the right isolation point in long lists
Frustration over no access to critical isolation point information
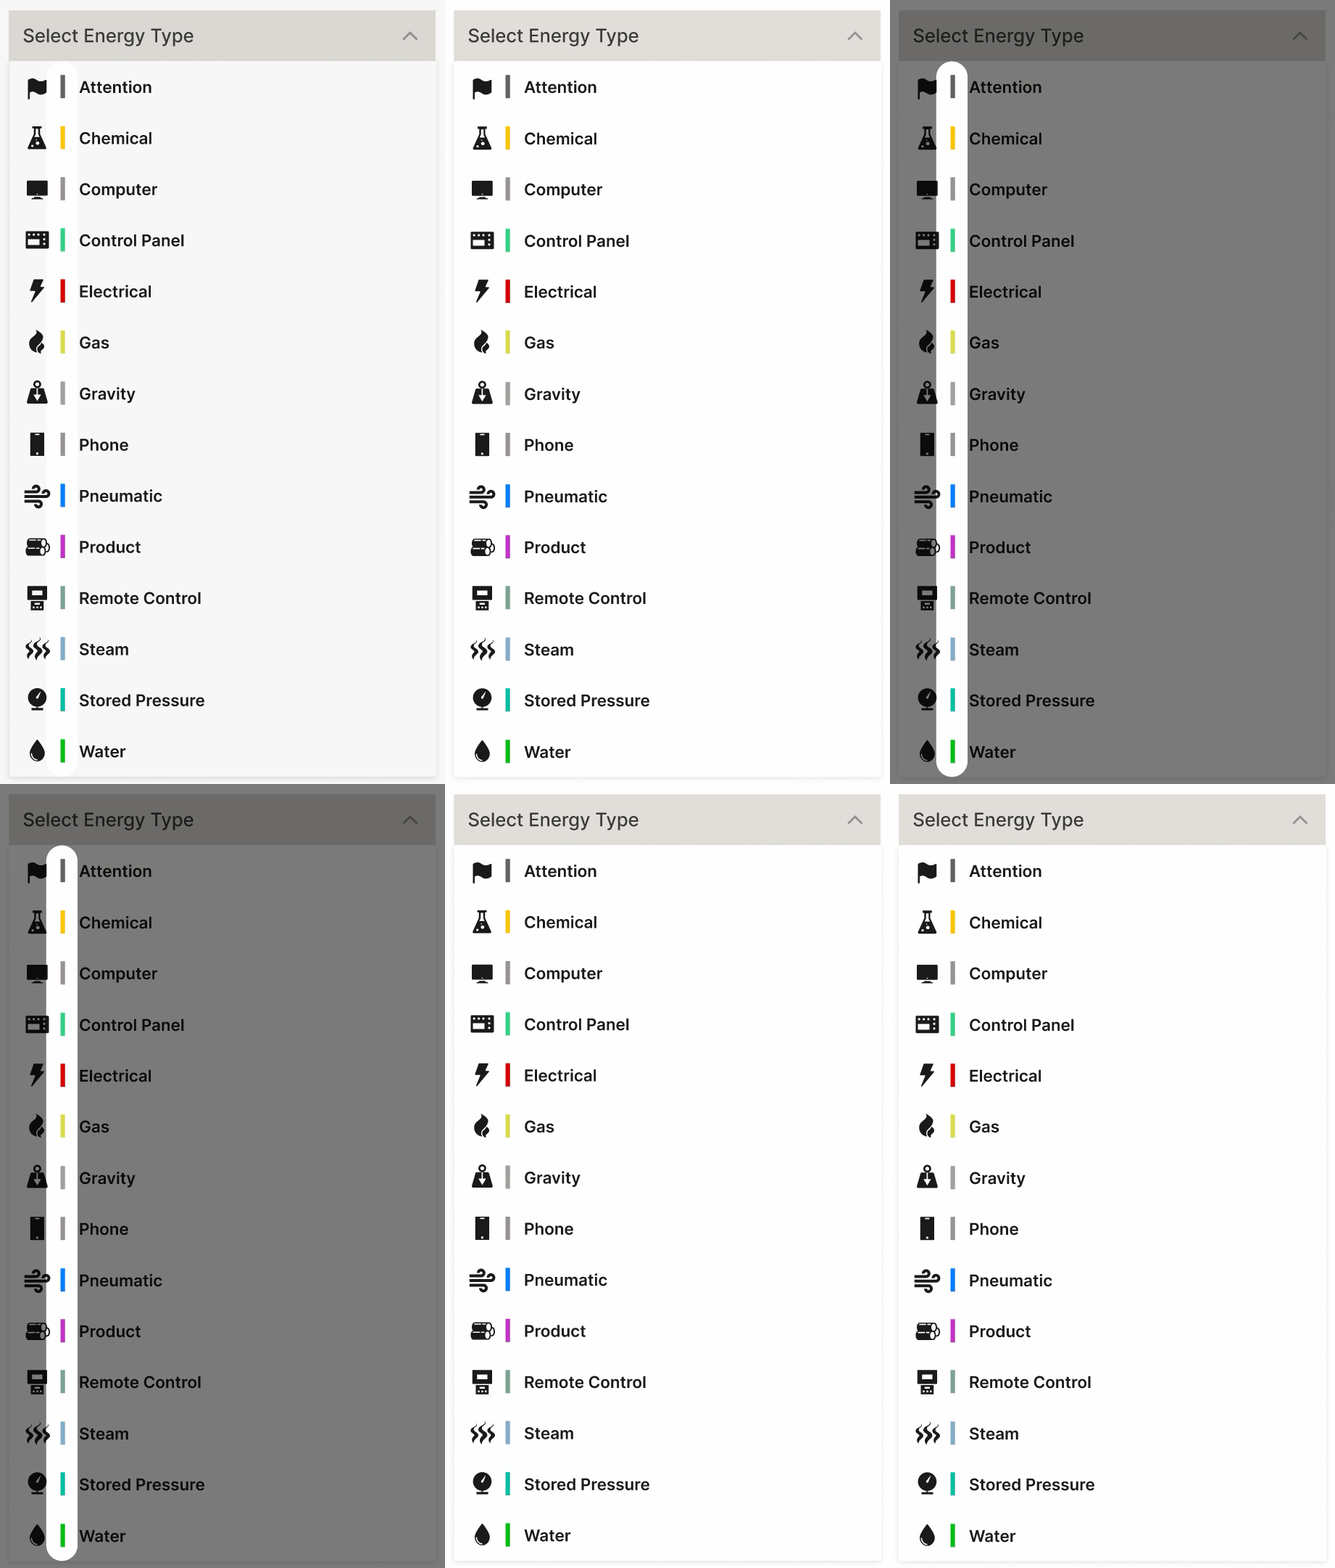
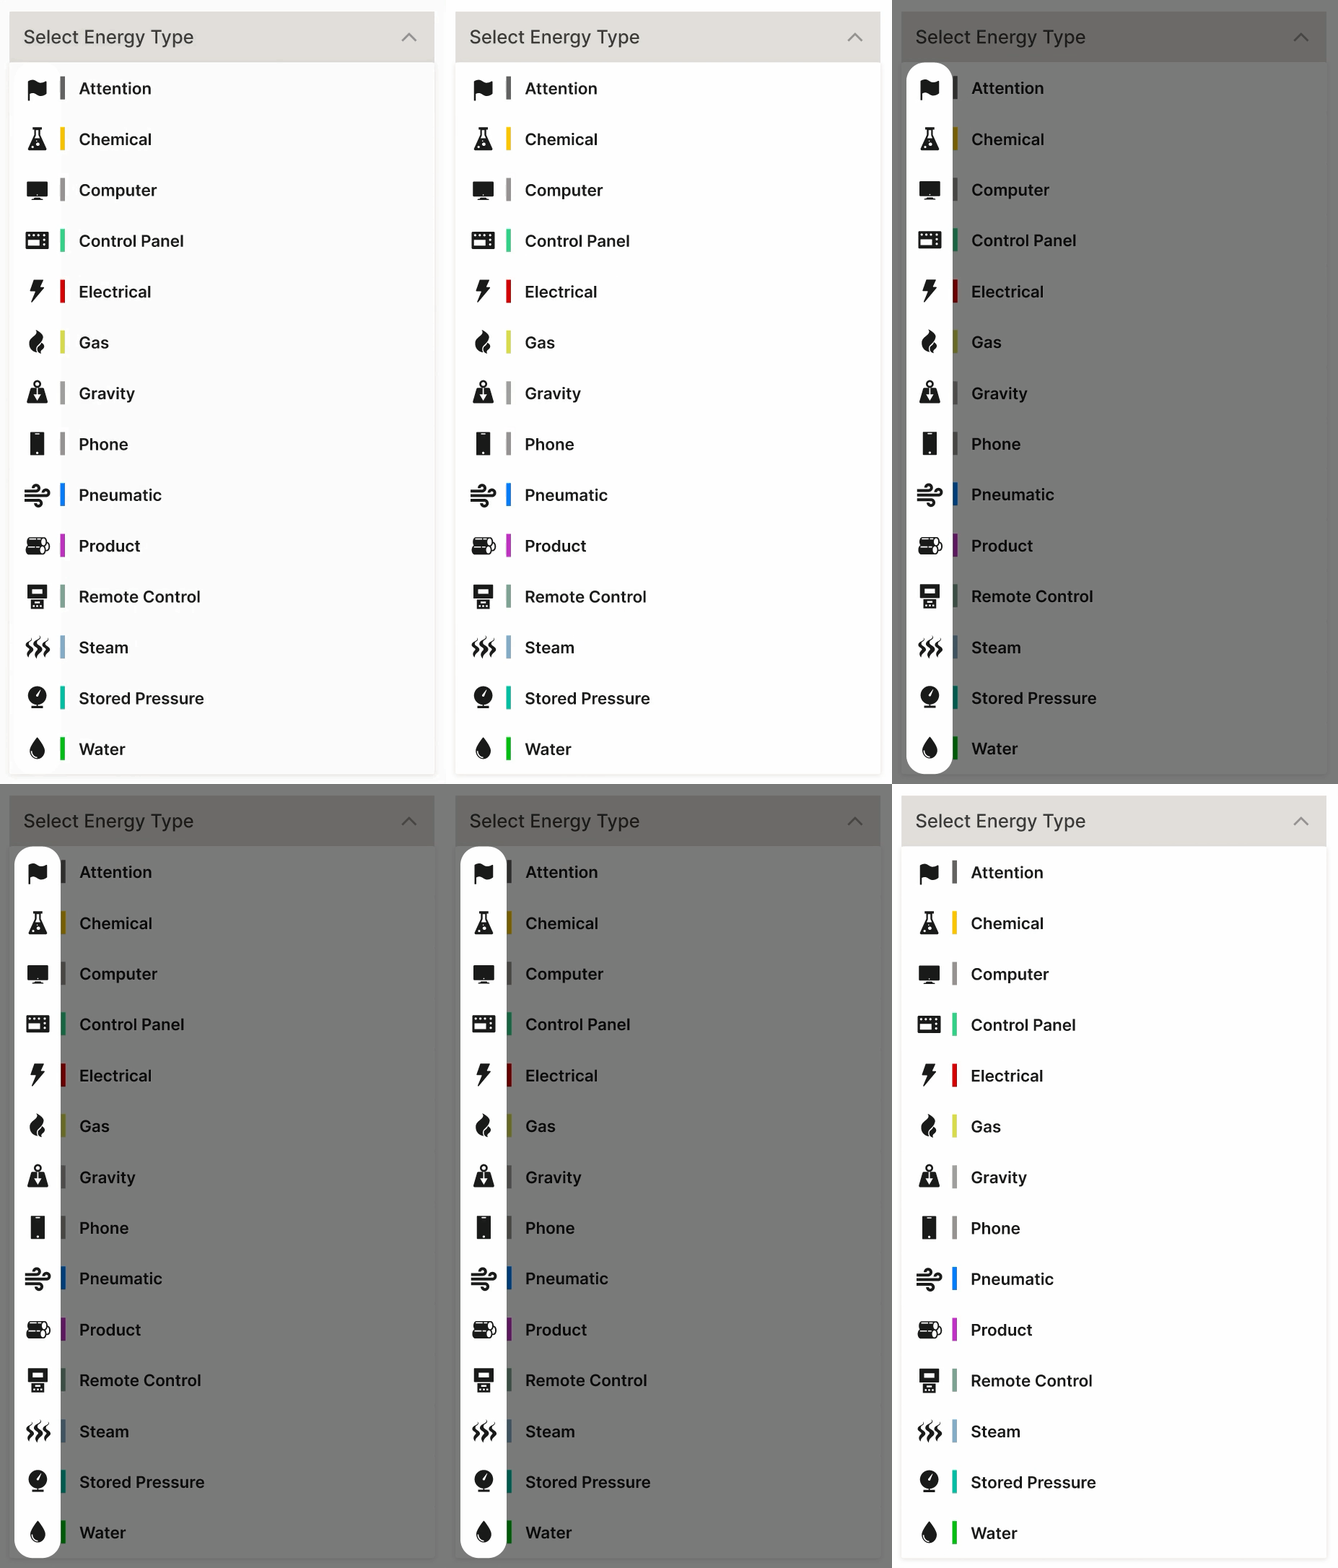
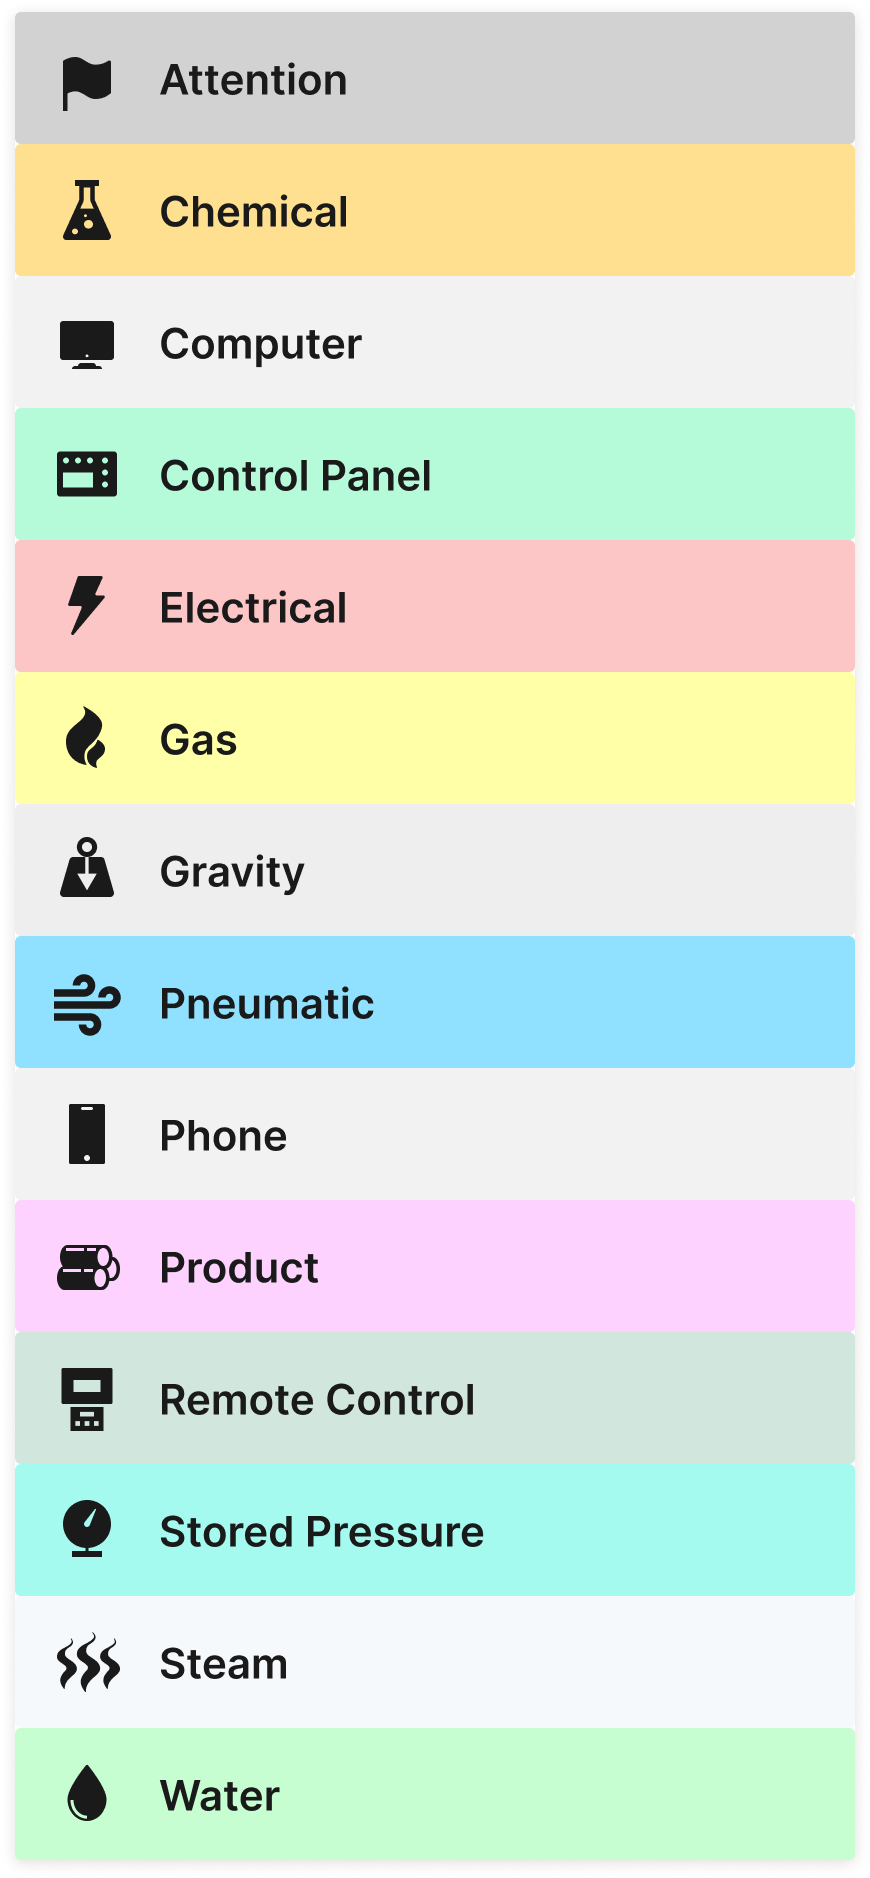
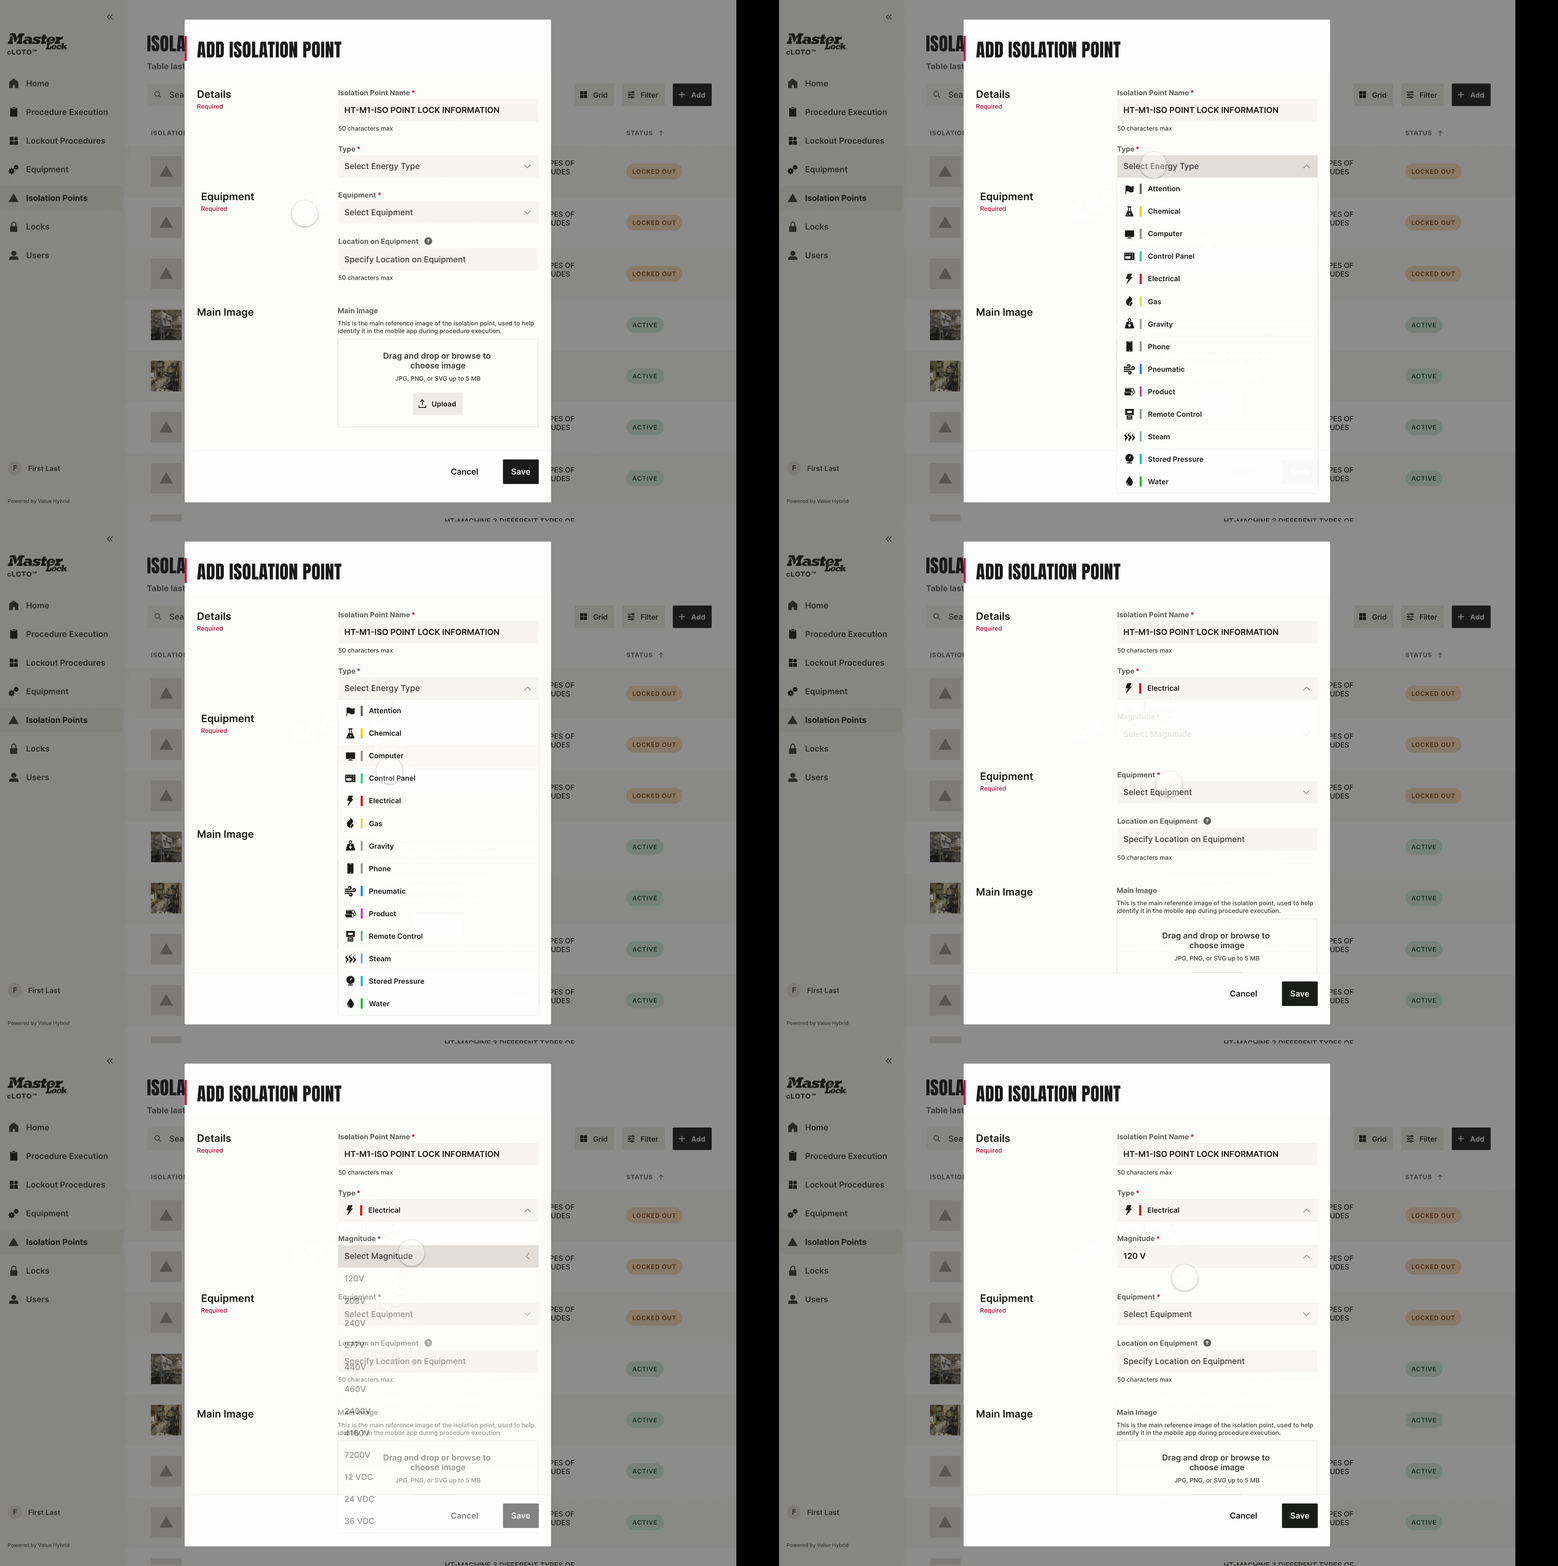
I worked with Sales and Product to define 15 field-aligned types, incorporating alpha user input. We also replaced confusing labels with terms more meaningful in the field.
addressed:
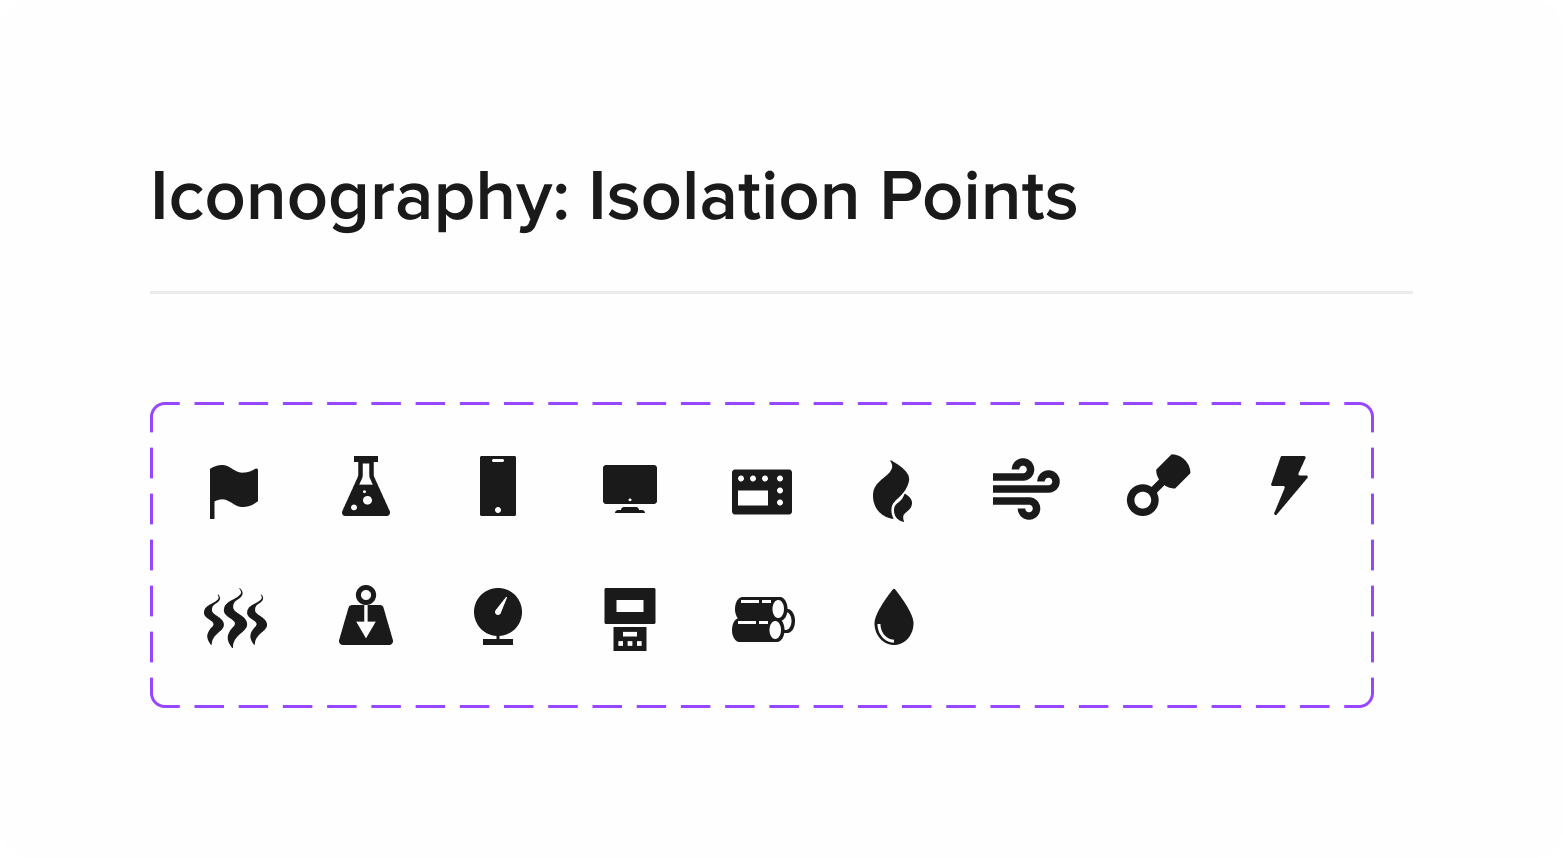
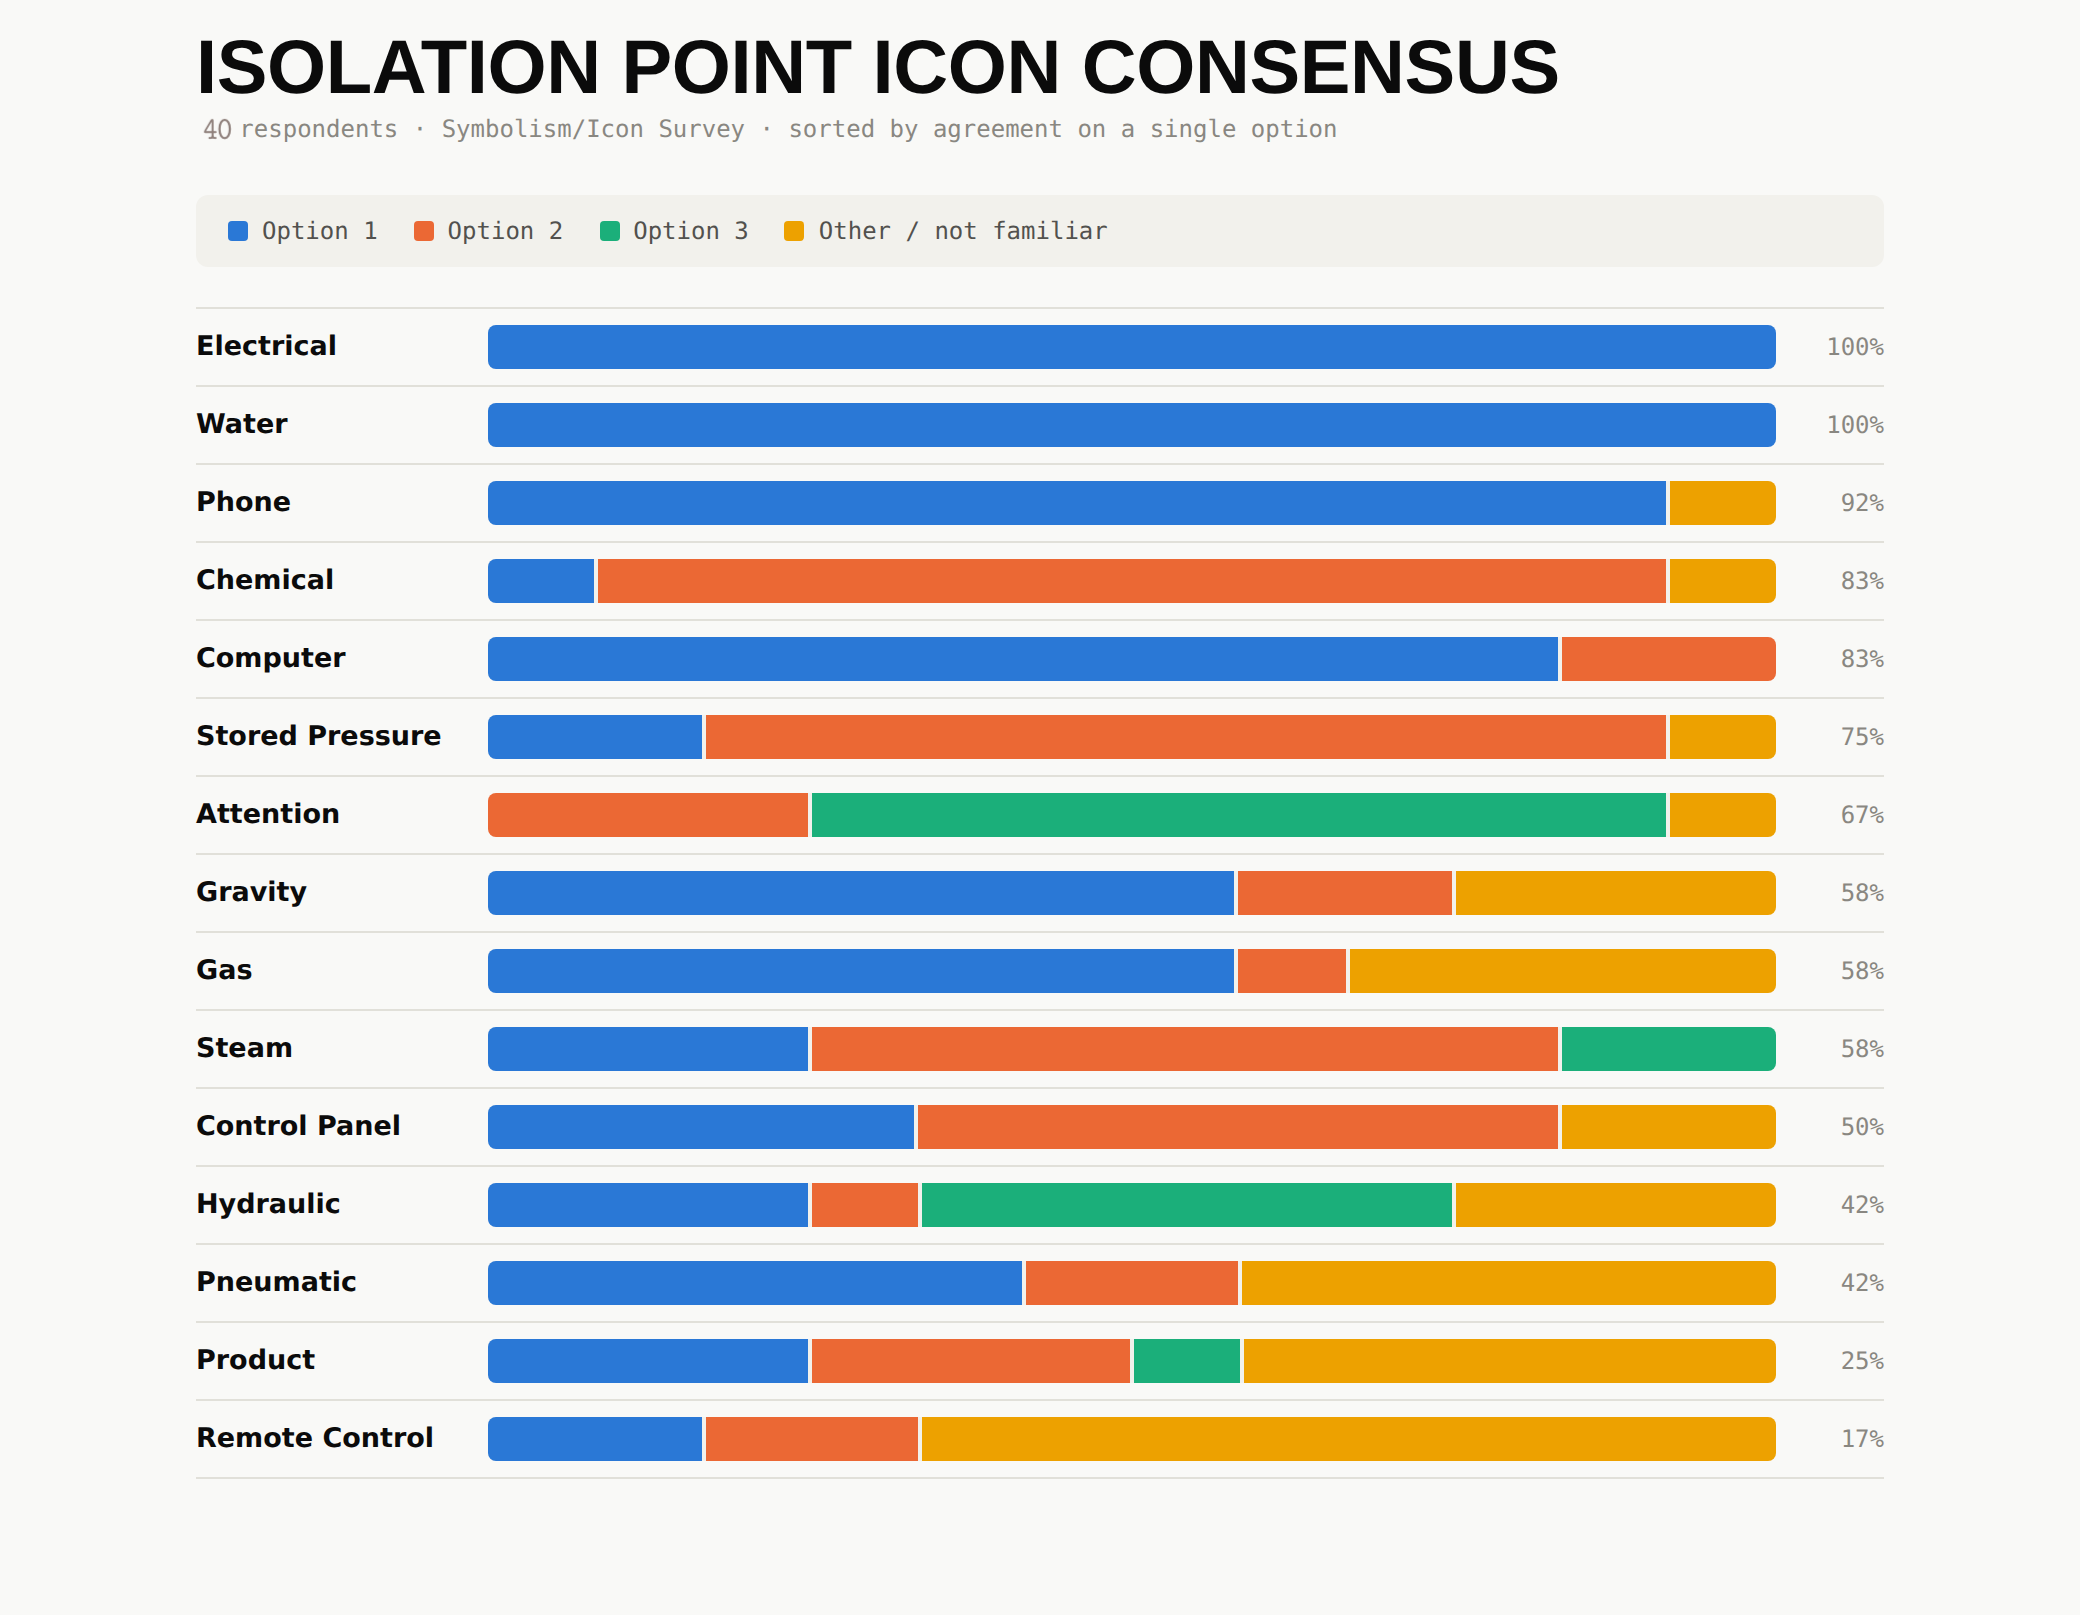
I ran a survey to identify the most recognizable symbol for each energy type, grounding the final icon set in user input.
addressed:
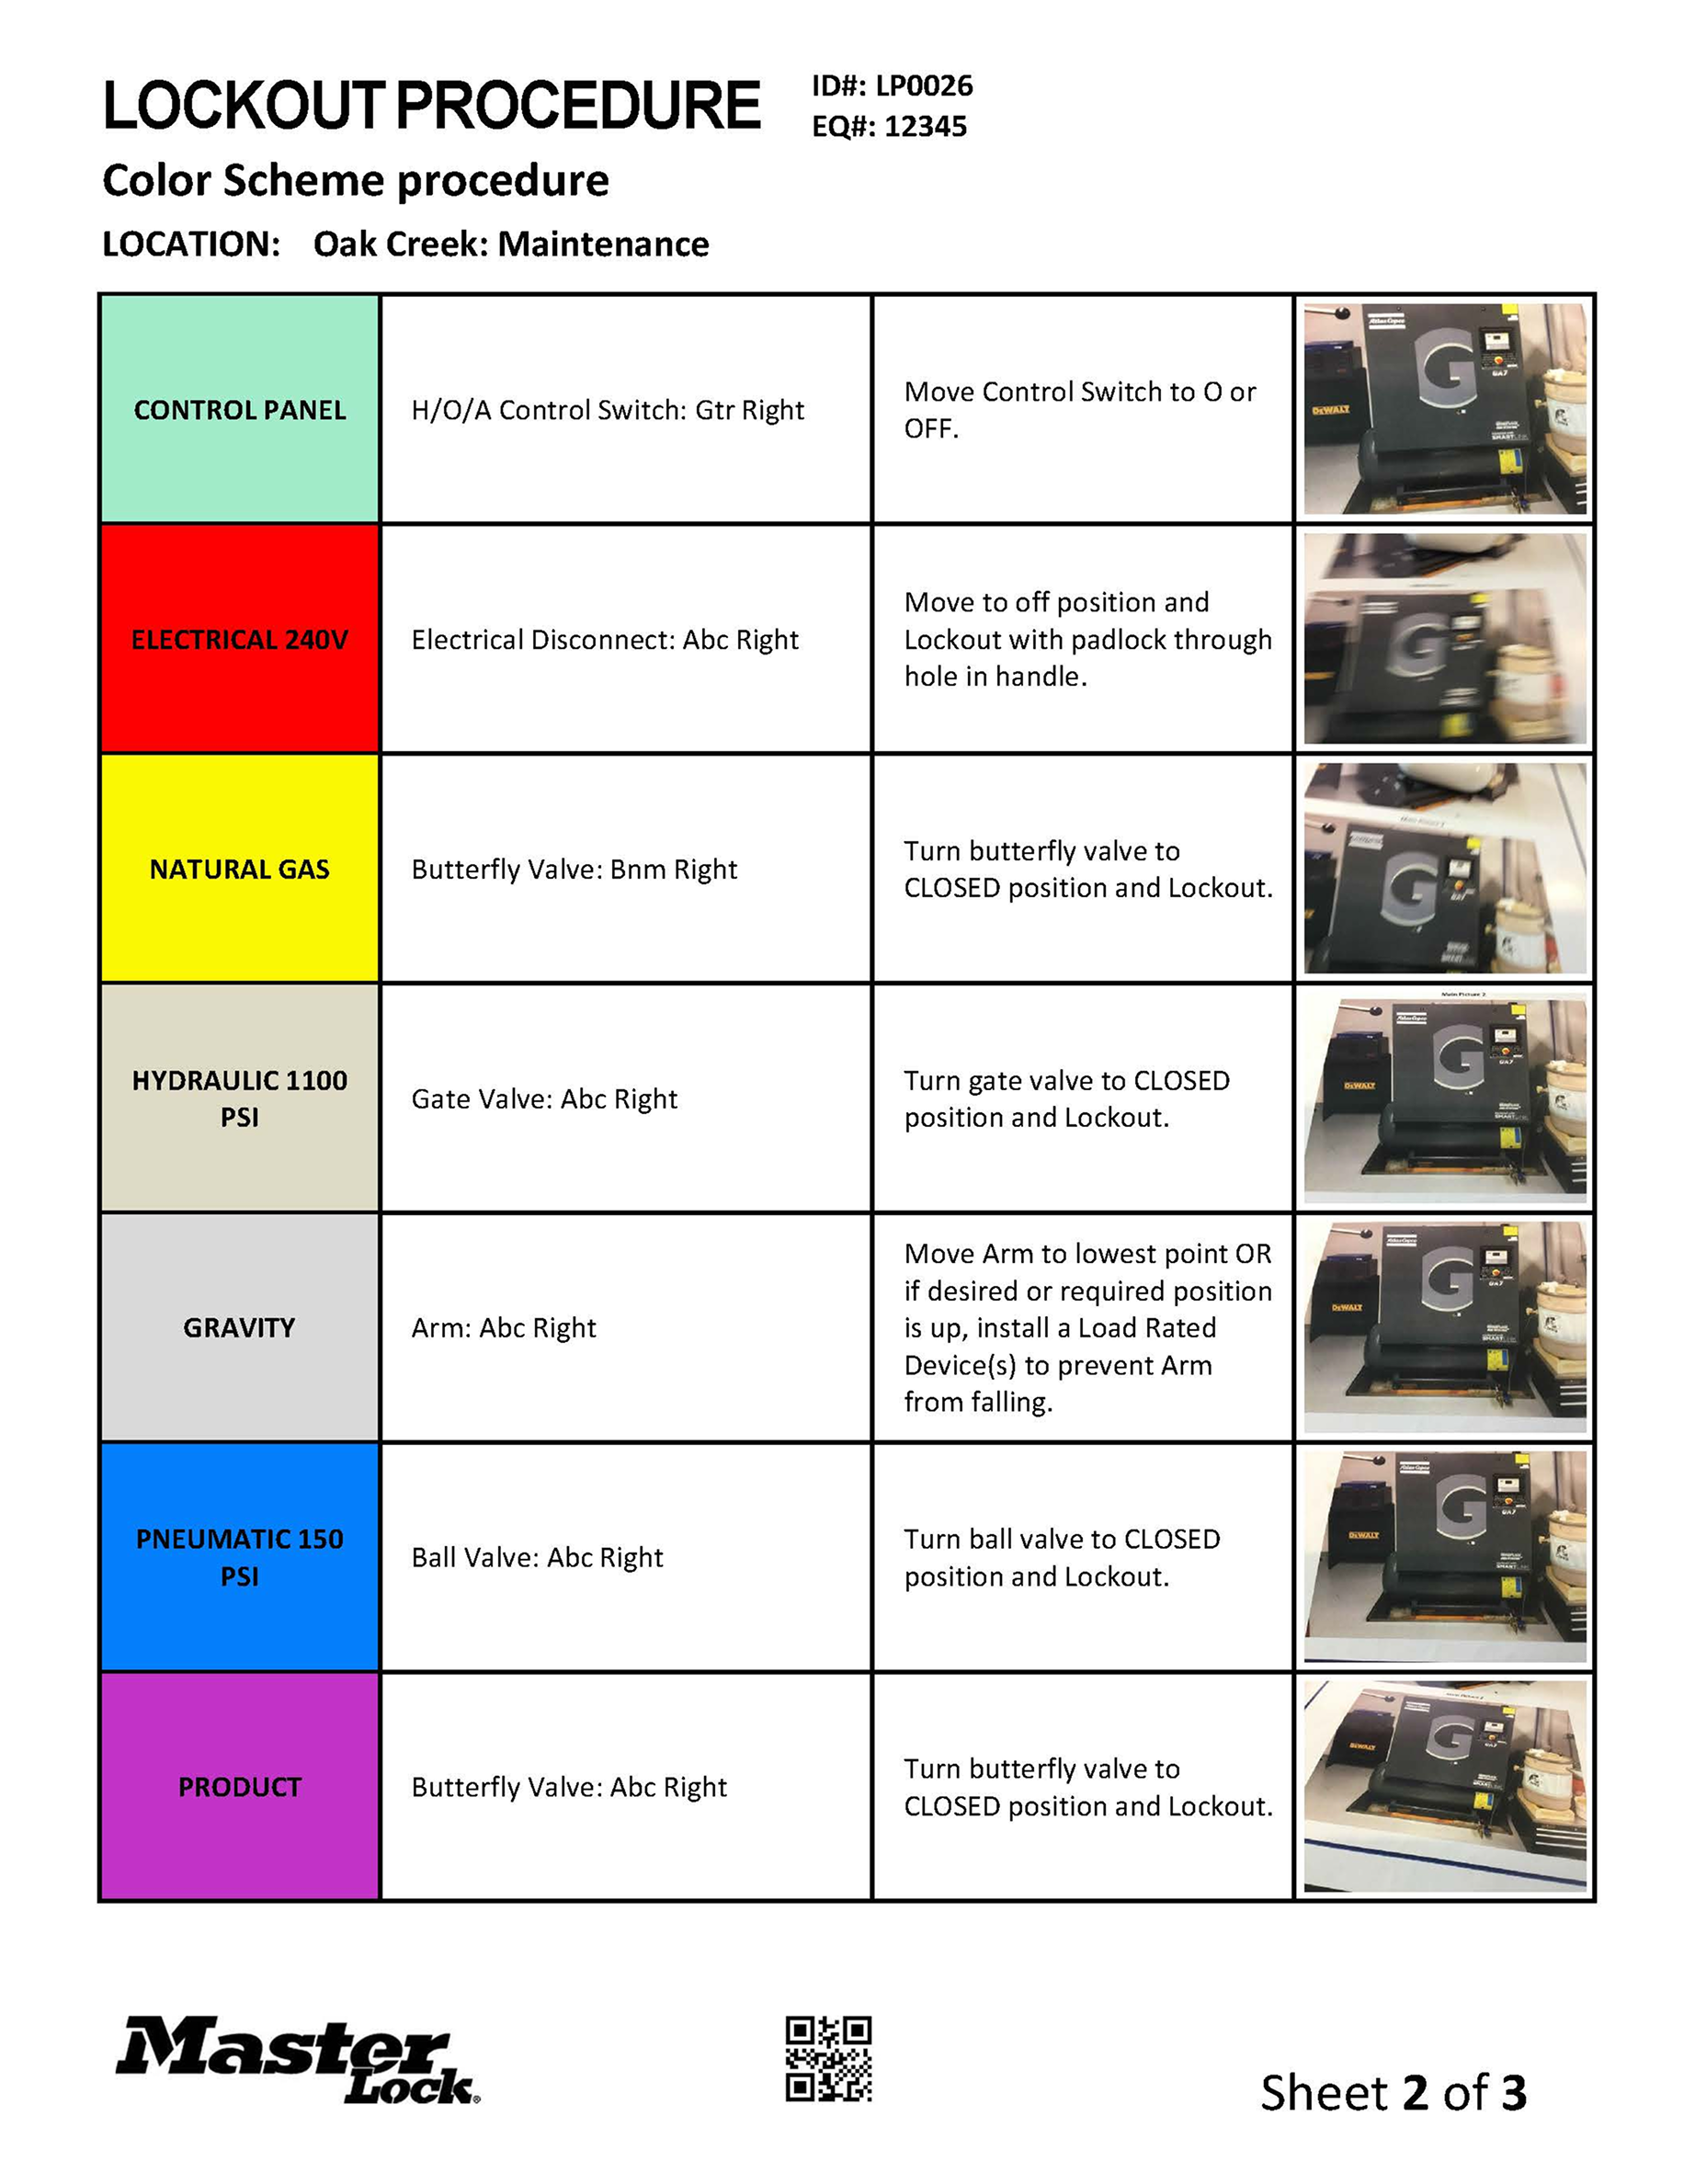
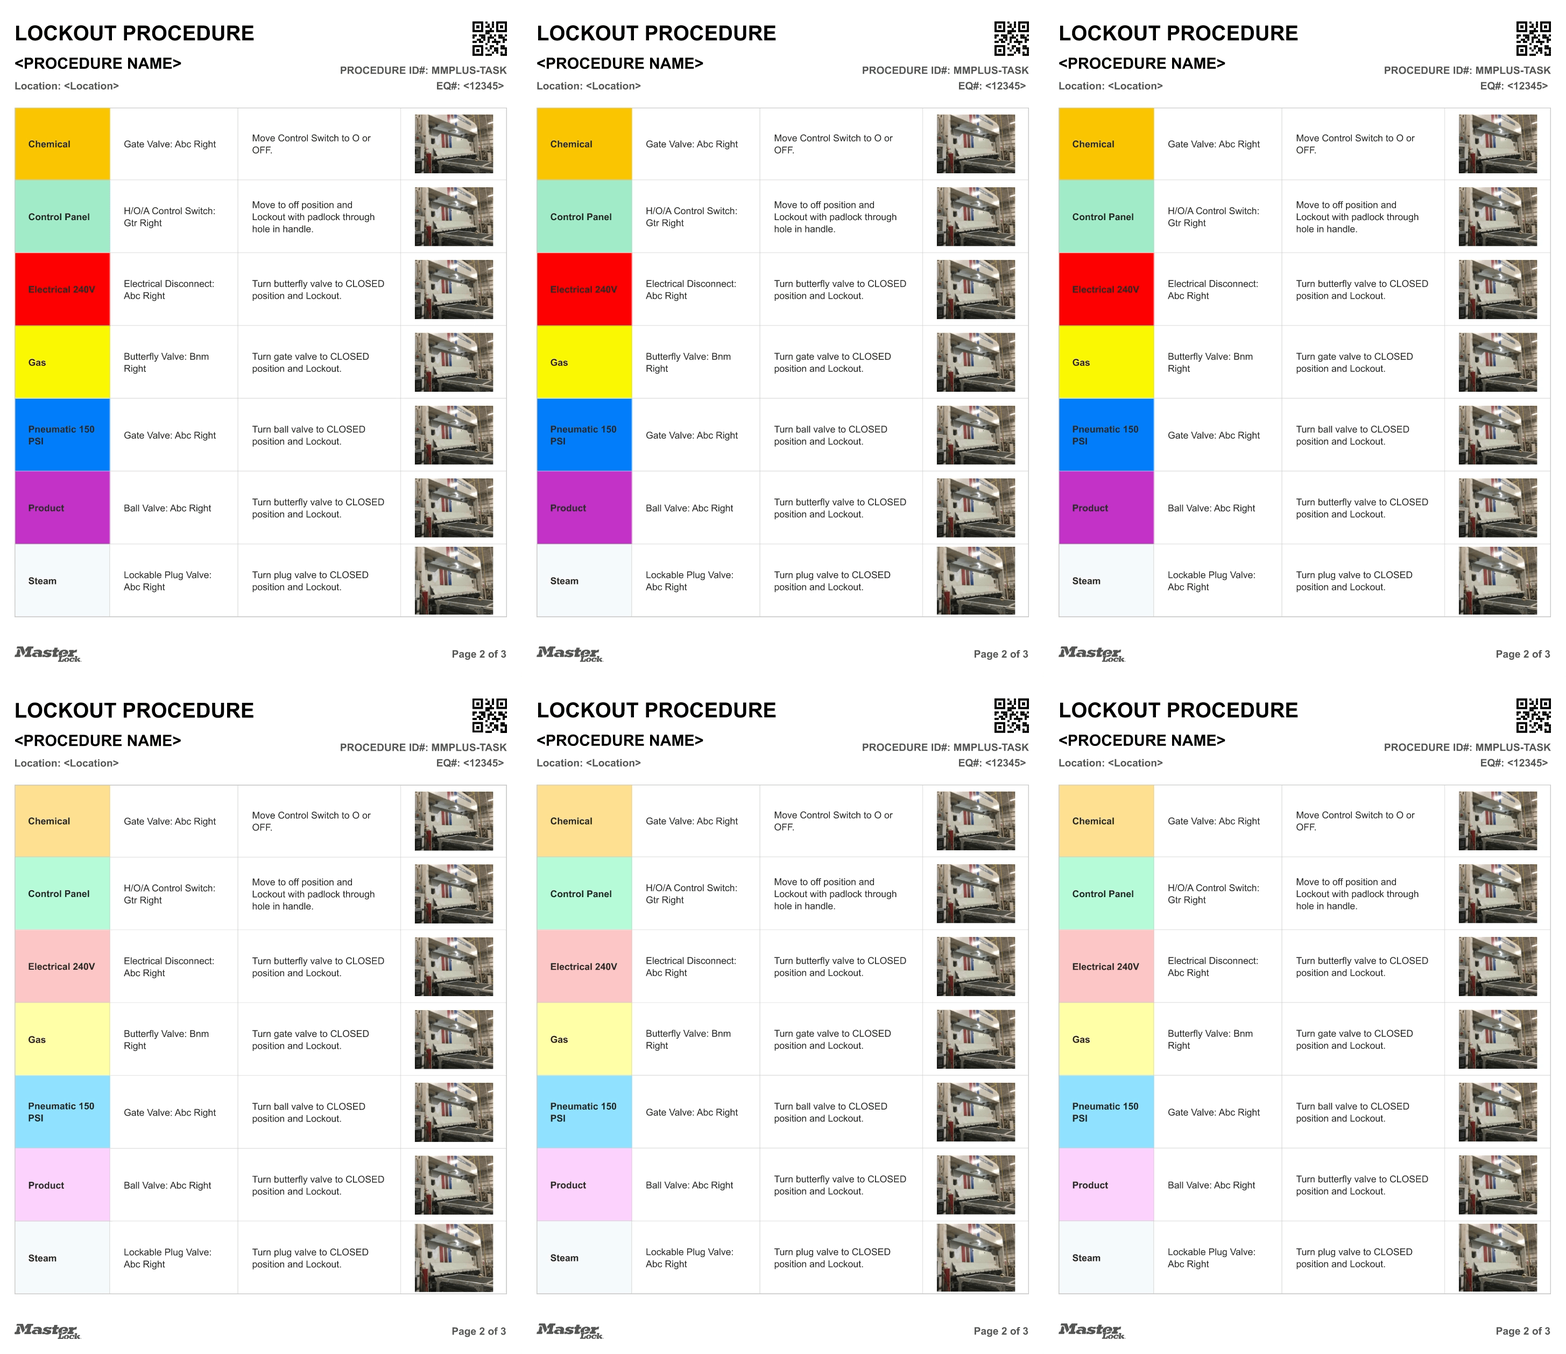
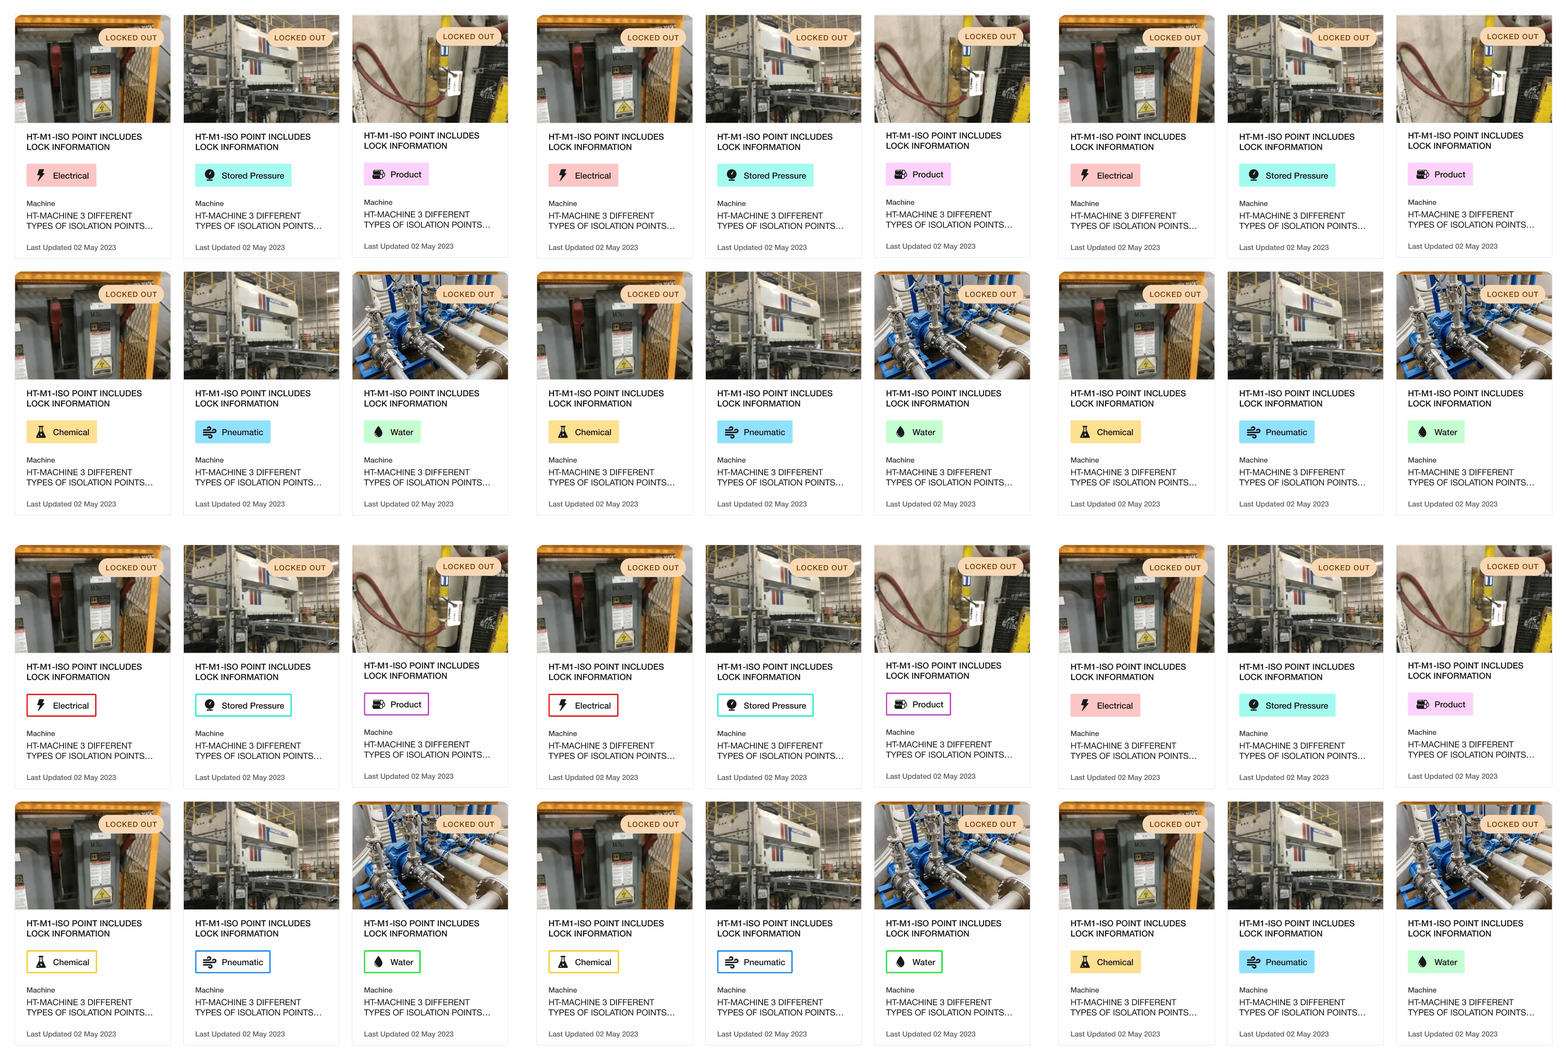
I reviewed printed lockout procedures used across industrial facilities and adopted their established color conventions.
addressed:


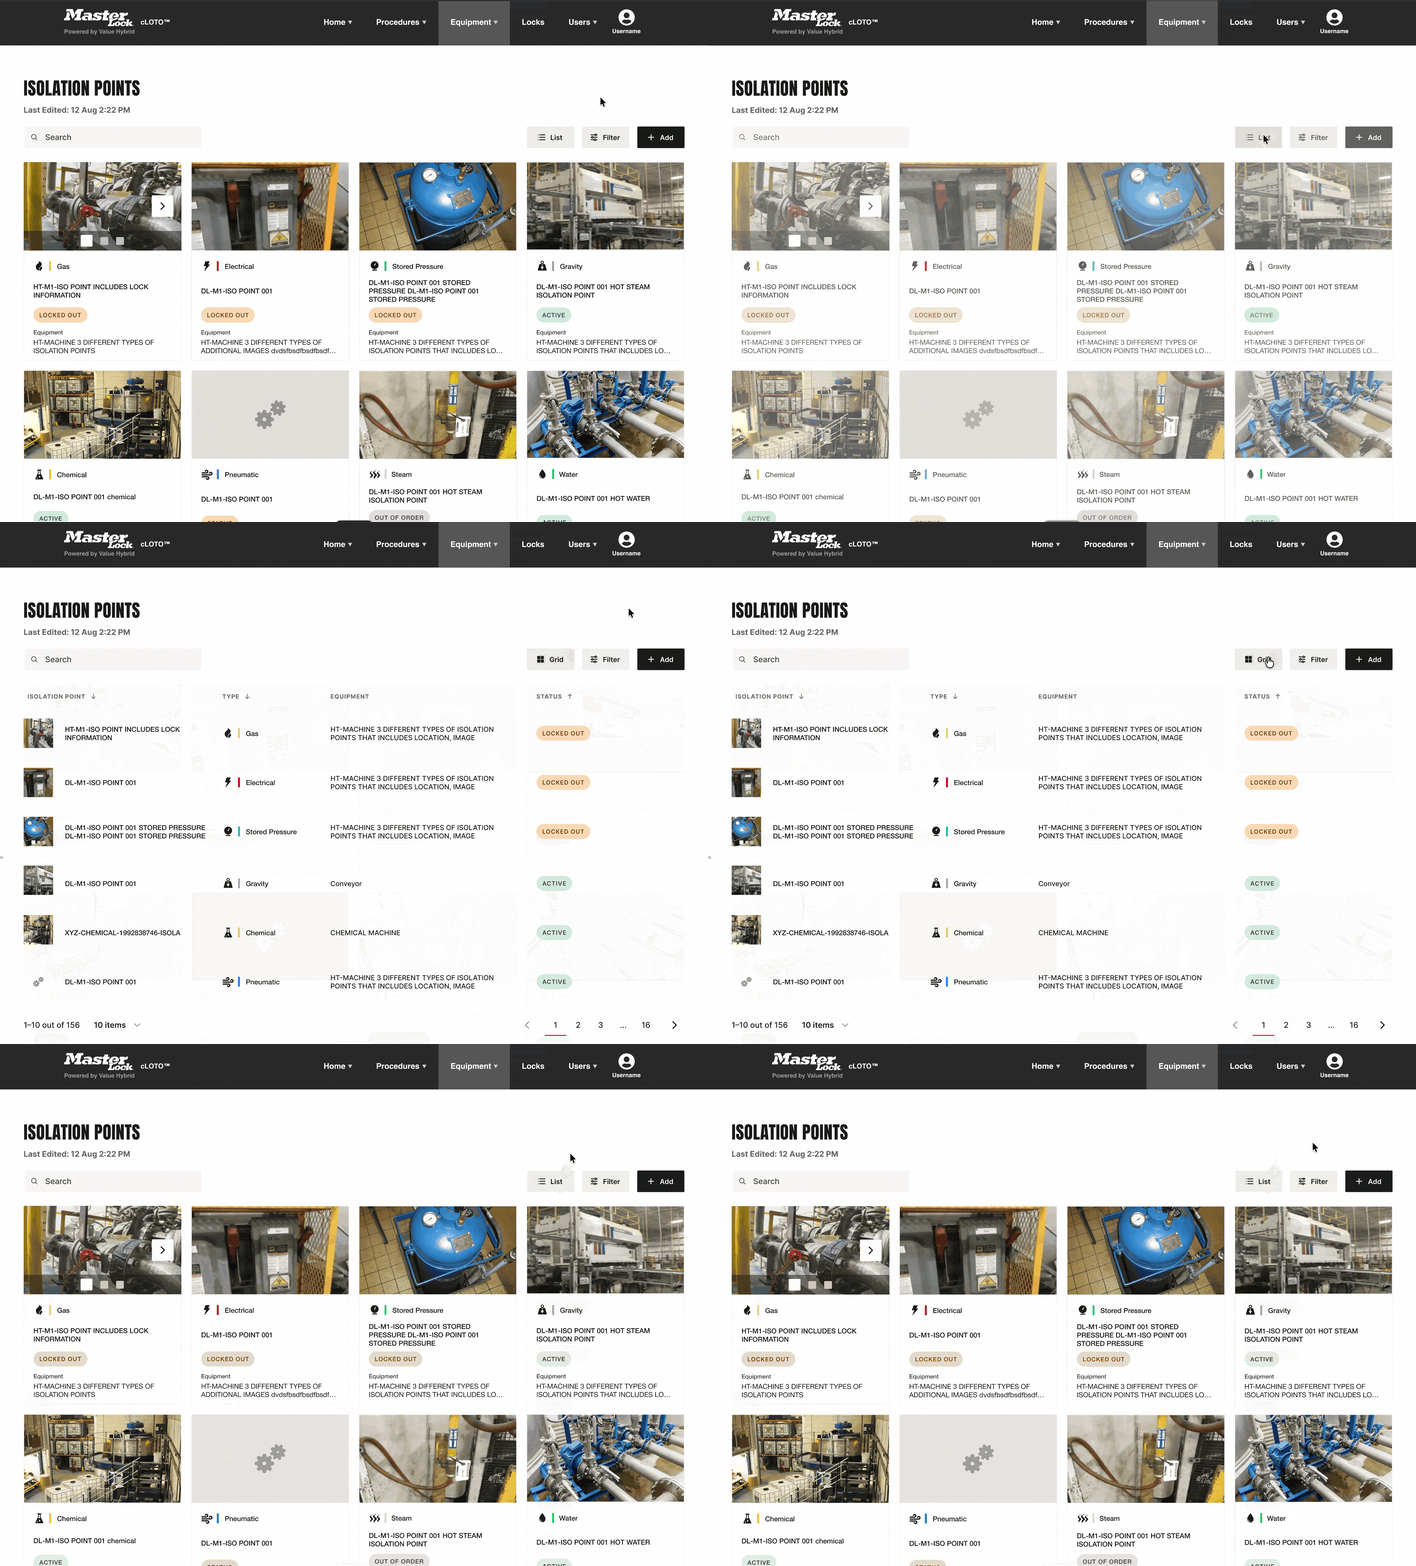
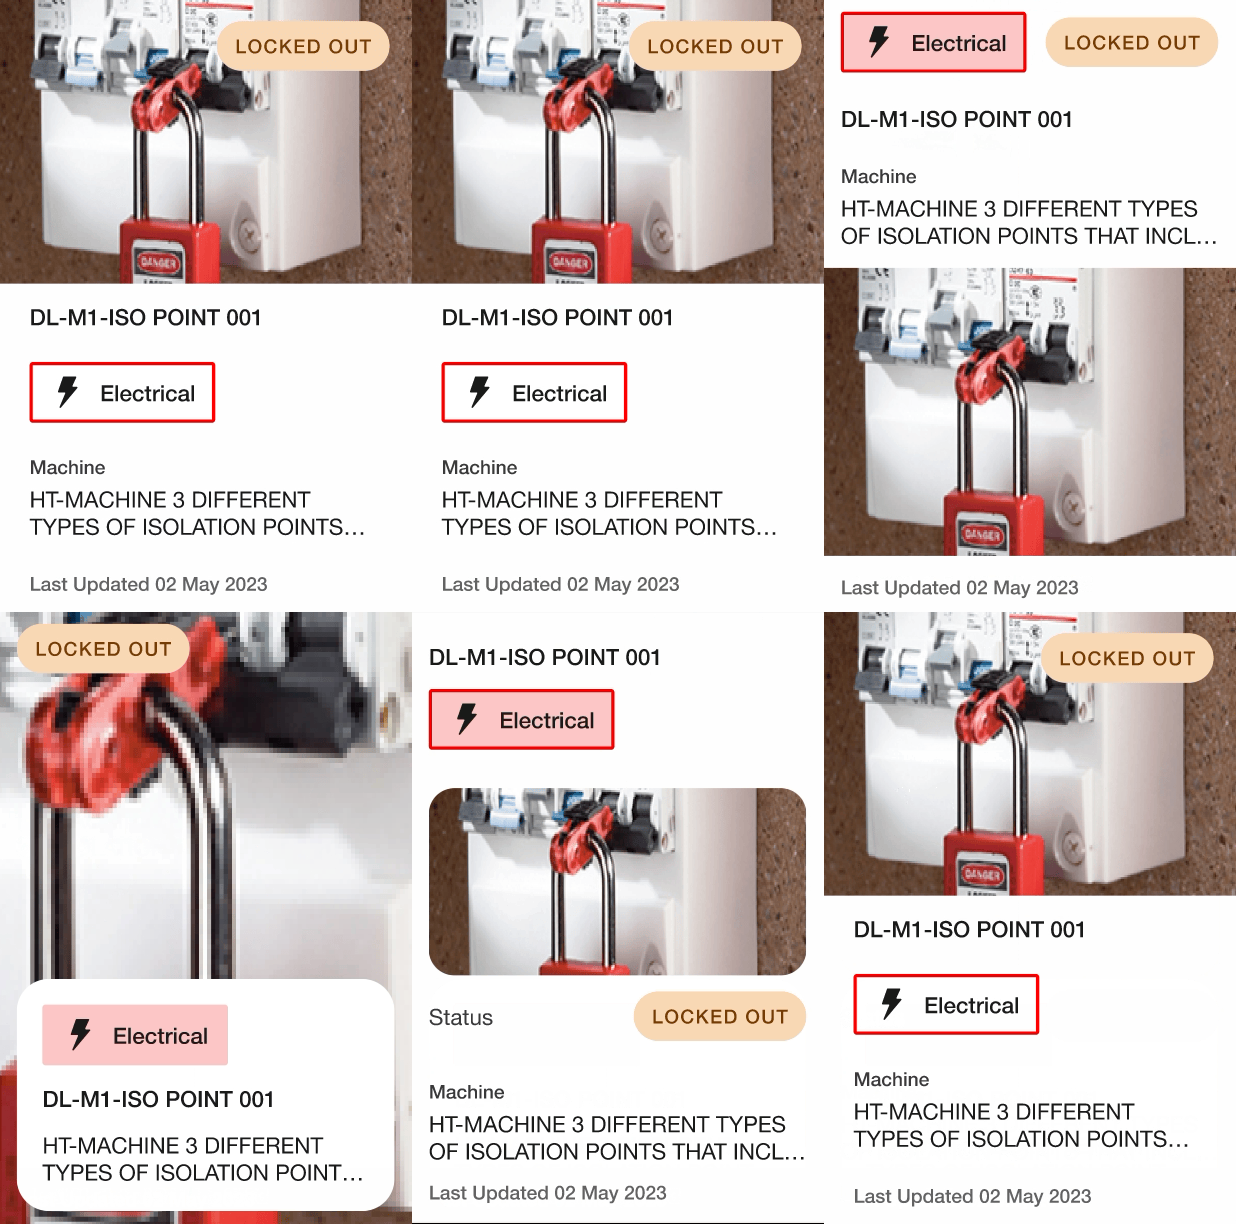
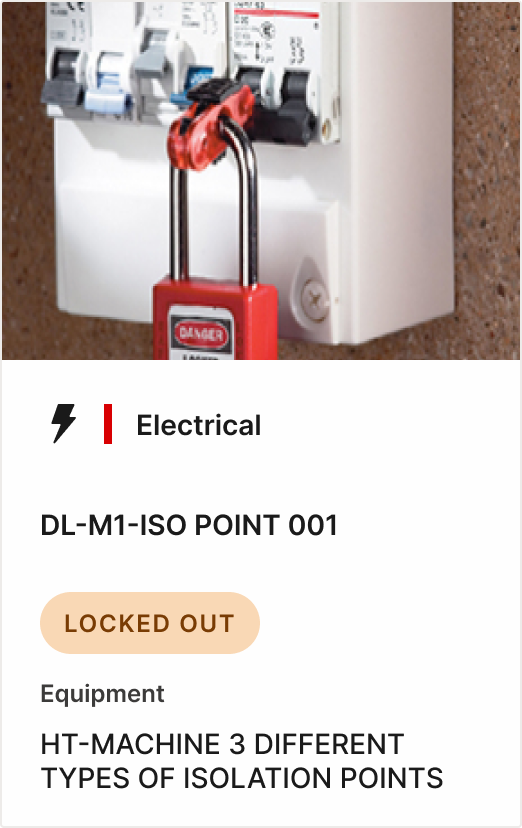
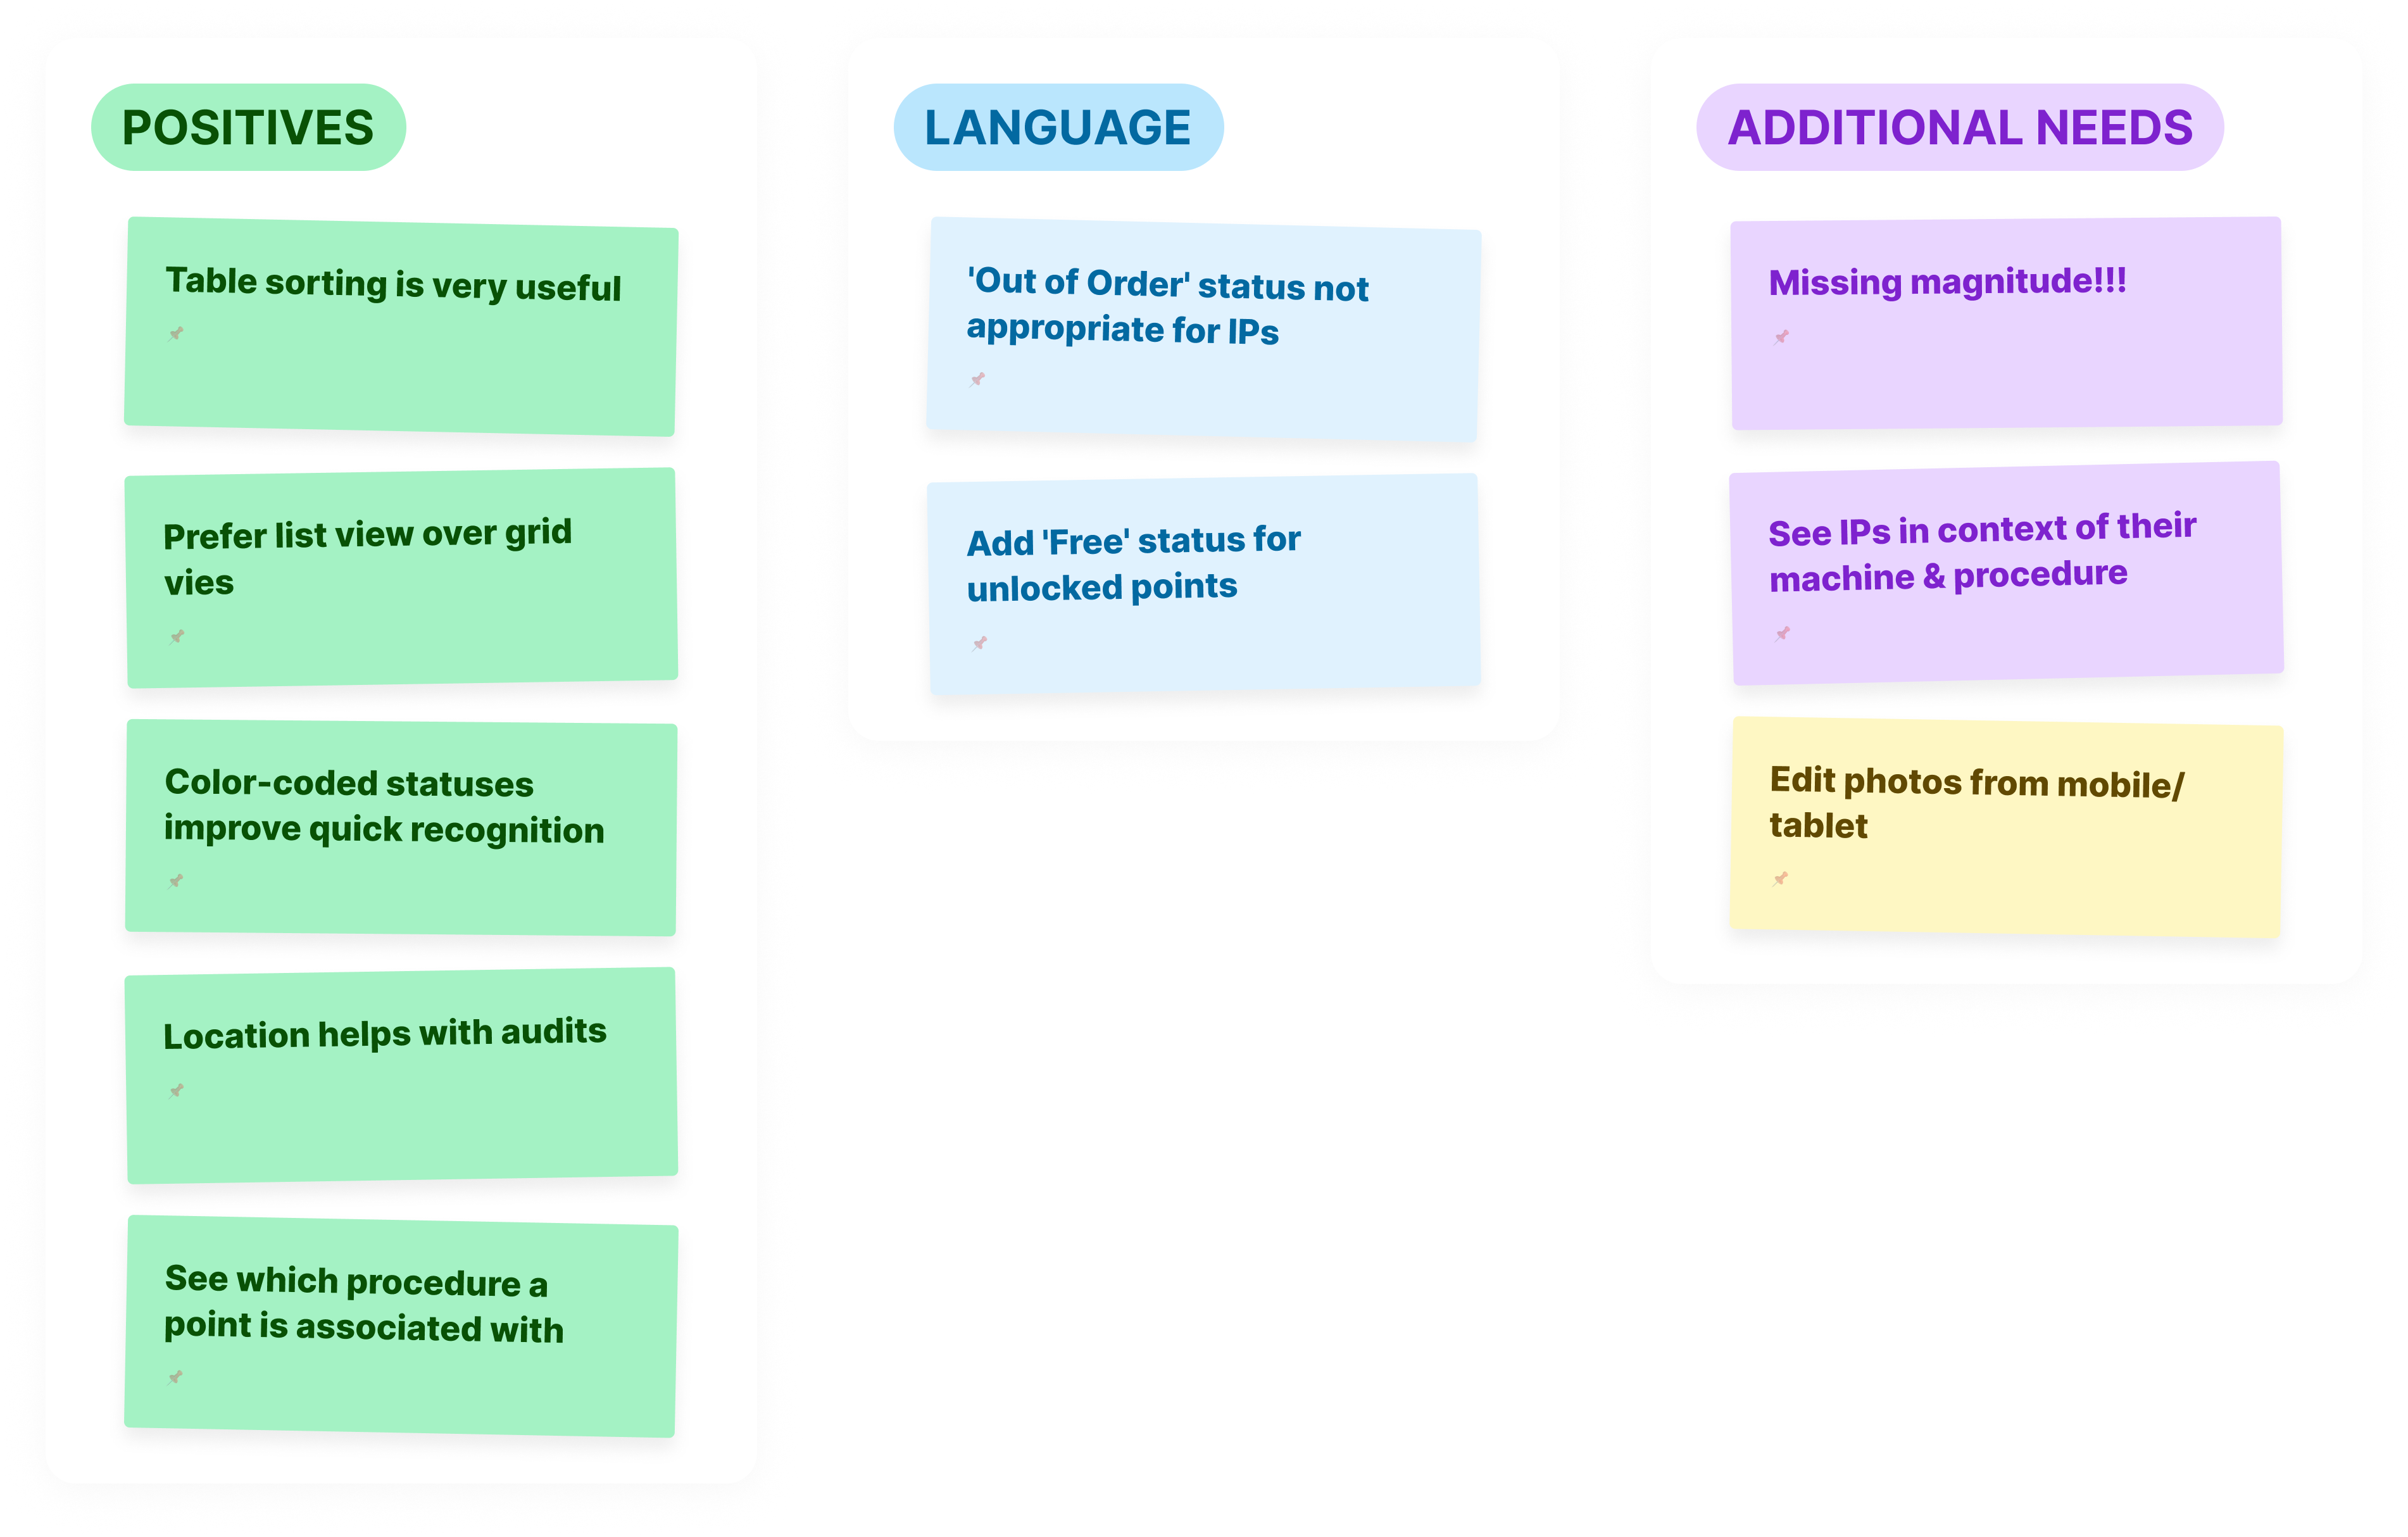
Knowing EHS managers were accustomed to spreadsheets, I added a table view for quick scanning while preserving the image-forward card view for visual identification, allowing users to easily switch between the two.
addressed:
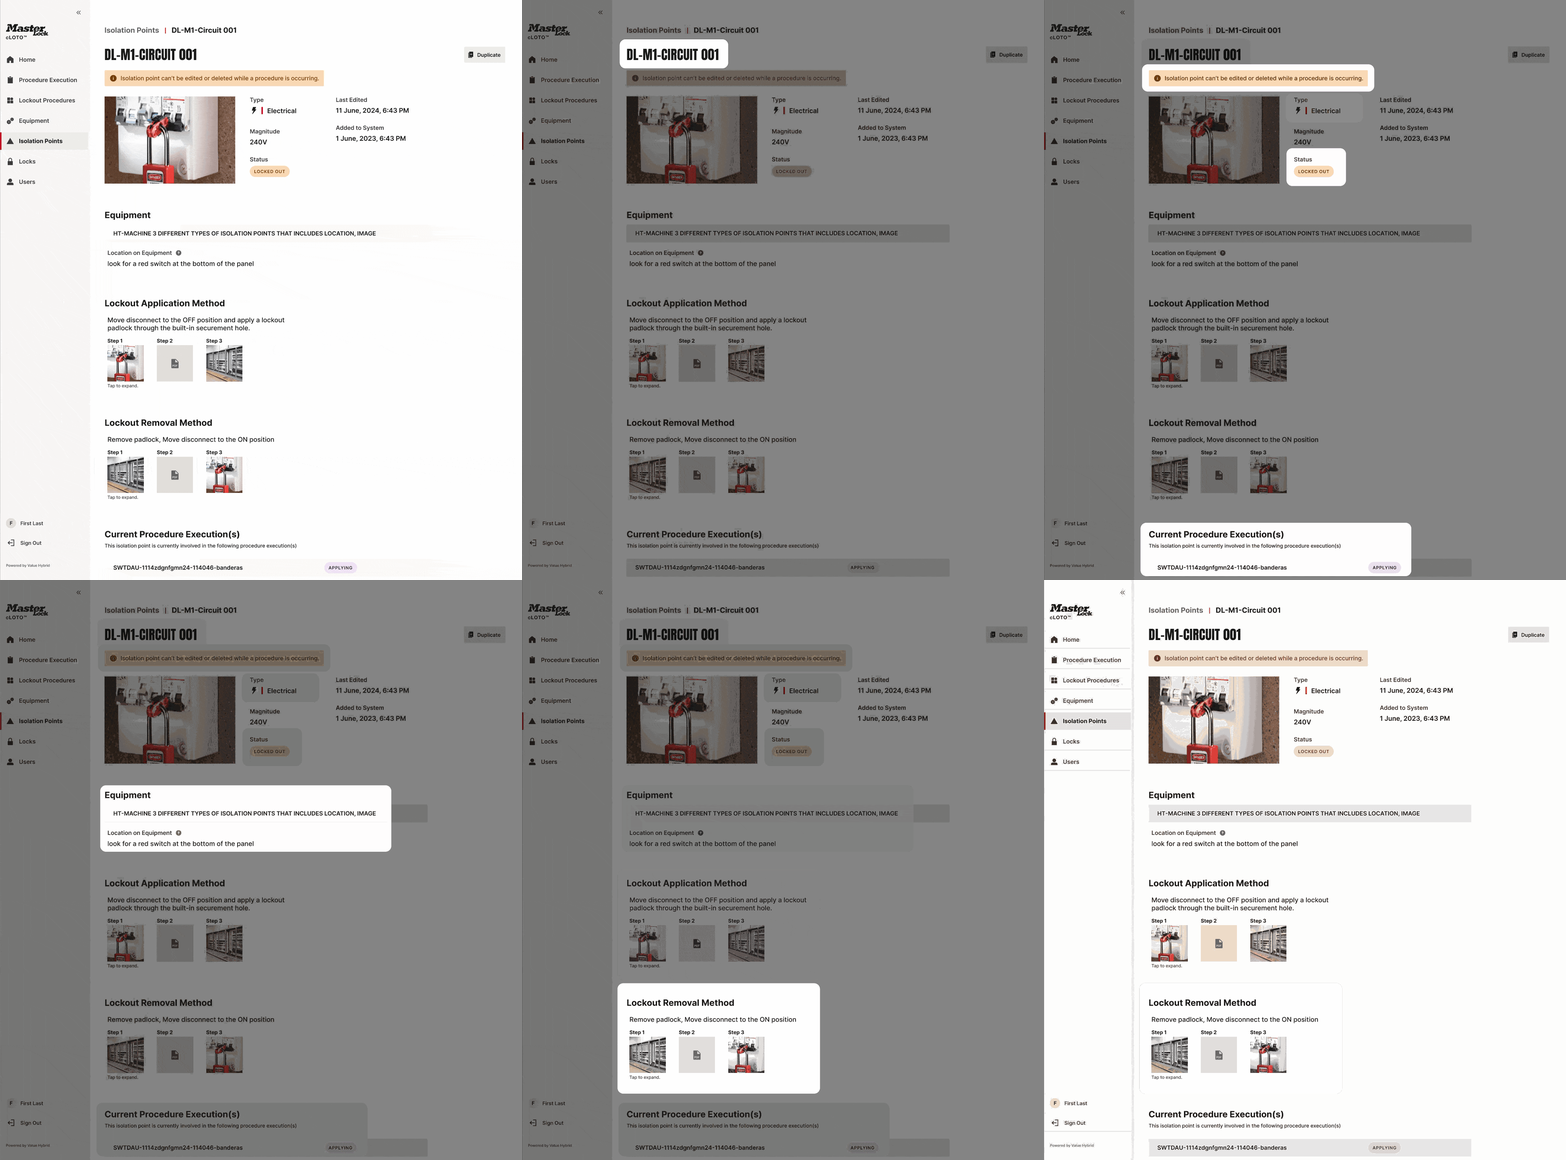
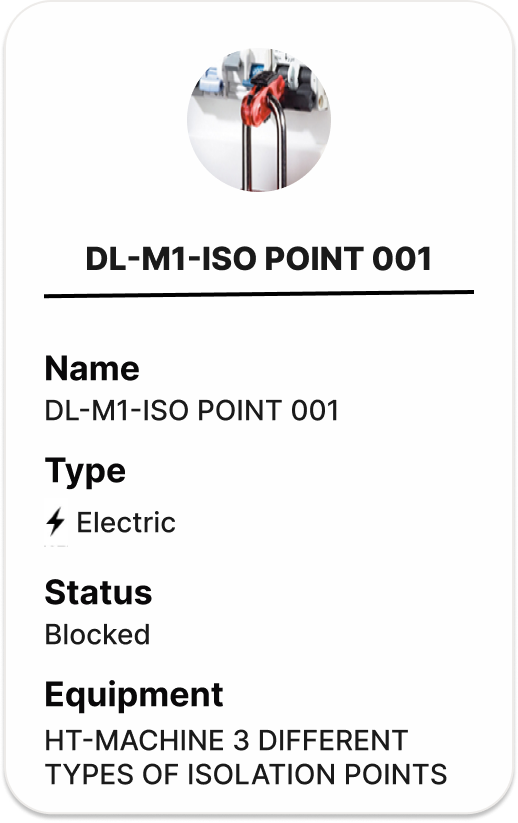
List or card views couldn't accommodate all the critical information. I used Claude Code to explore the data model, leading to a full-page view for each isolation point.
addressed:


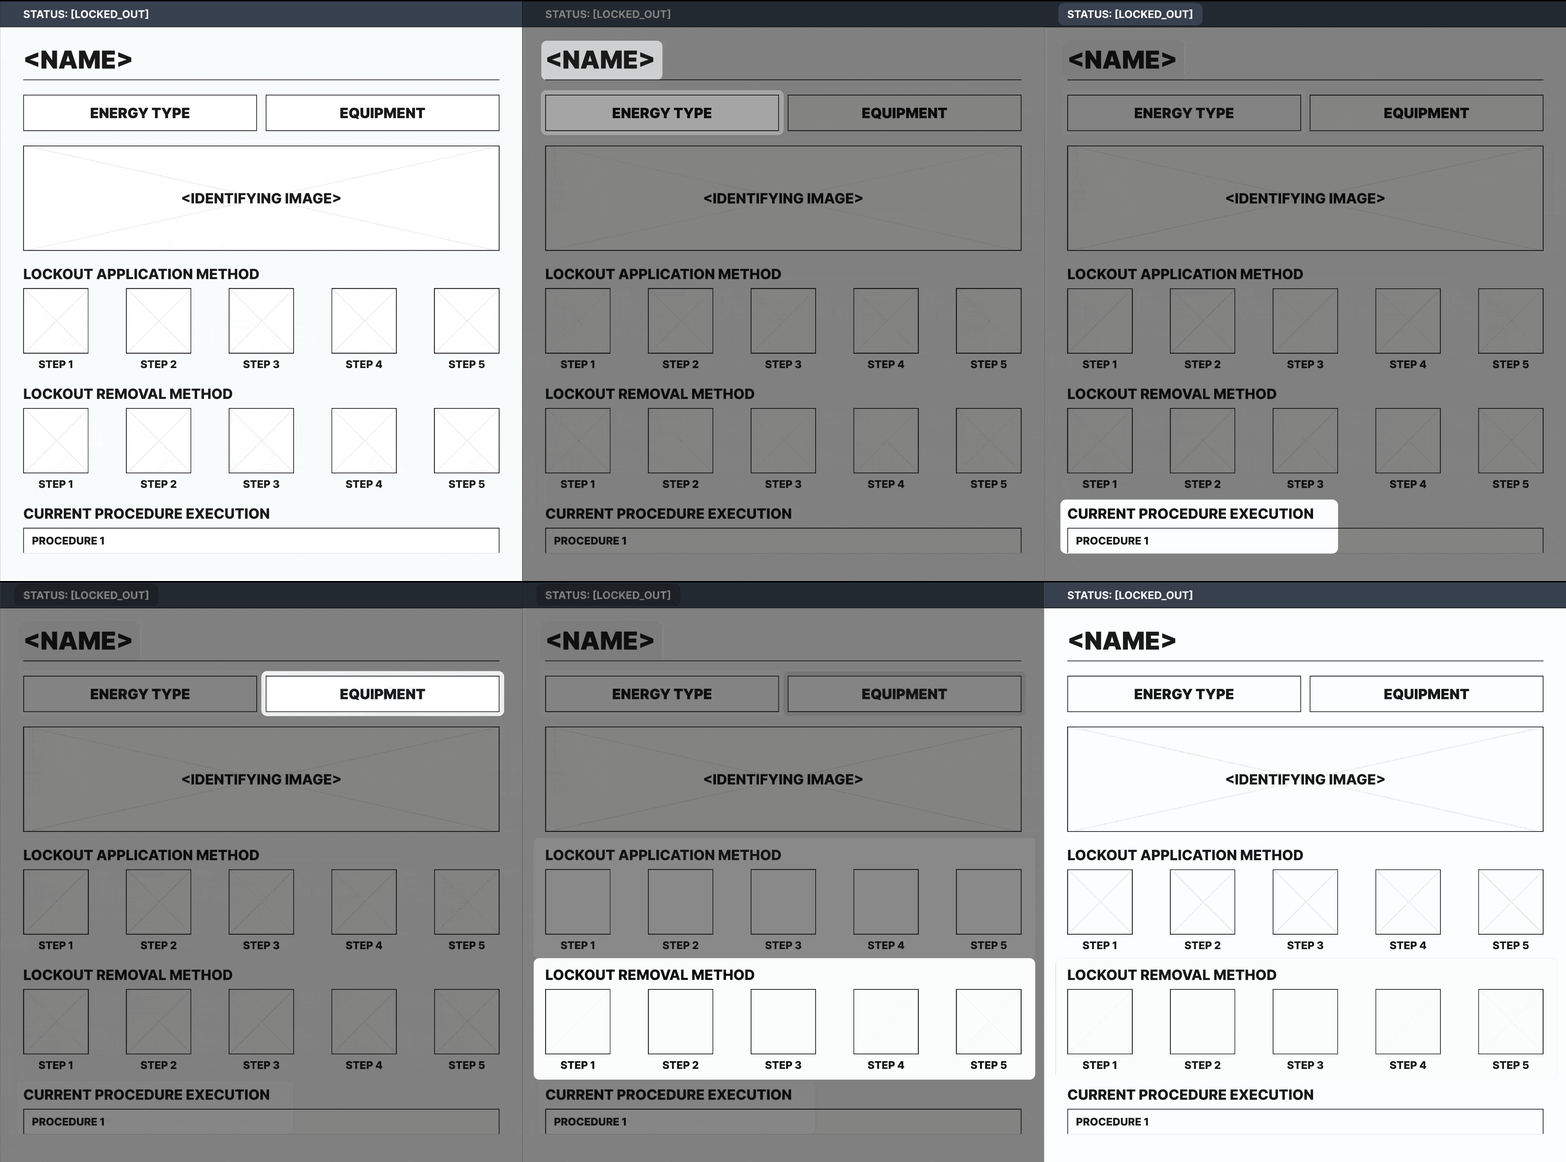
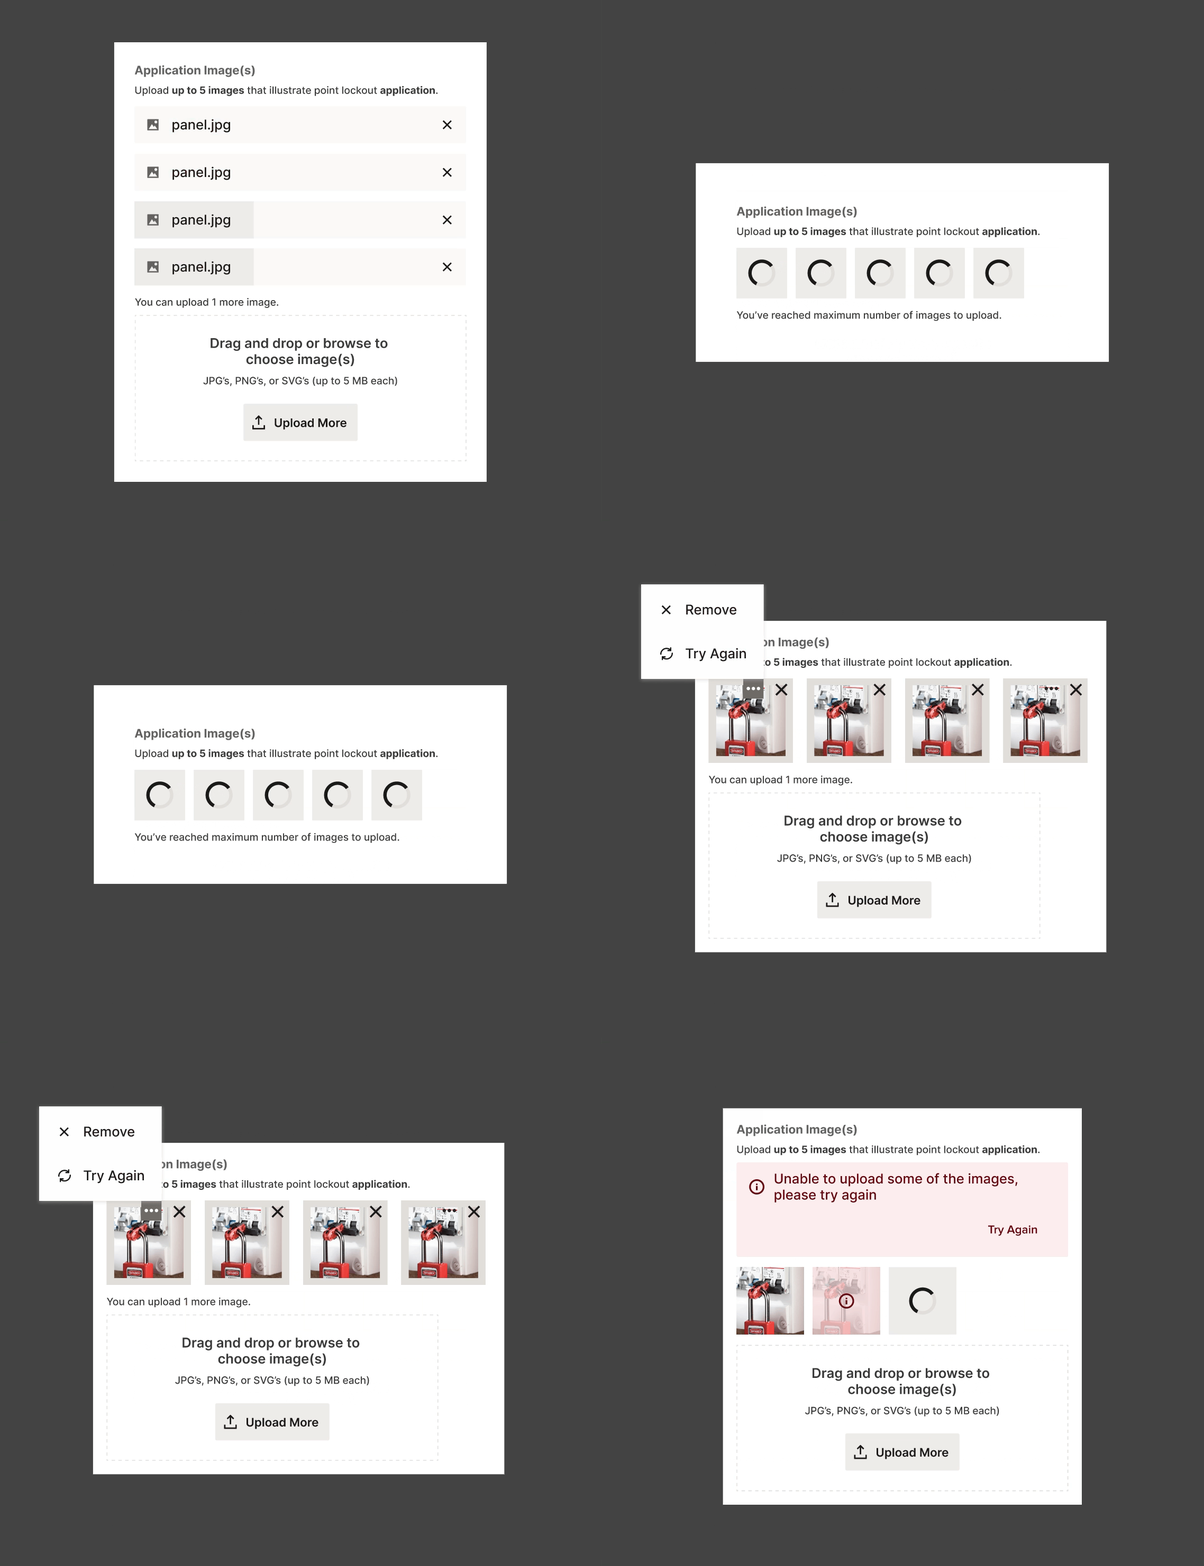
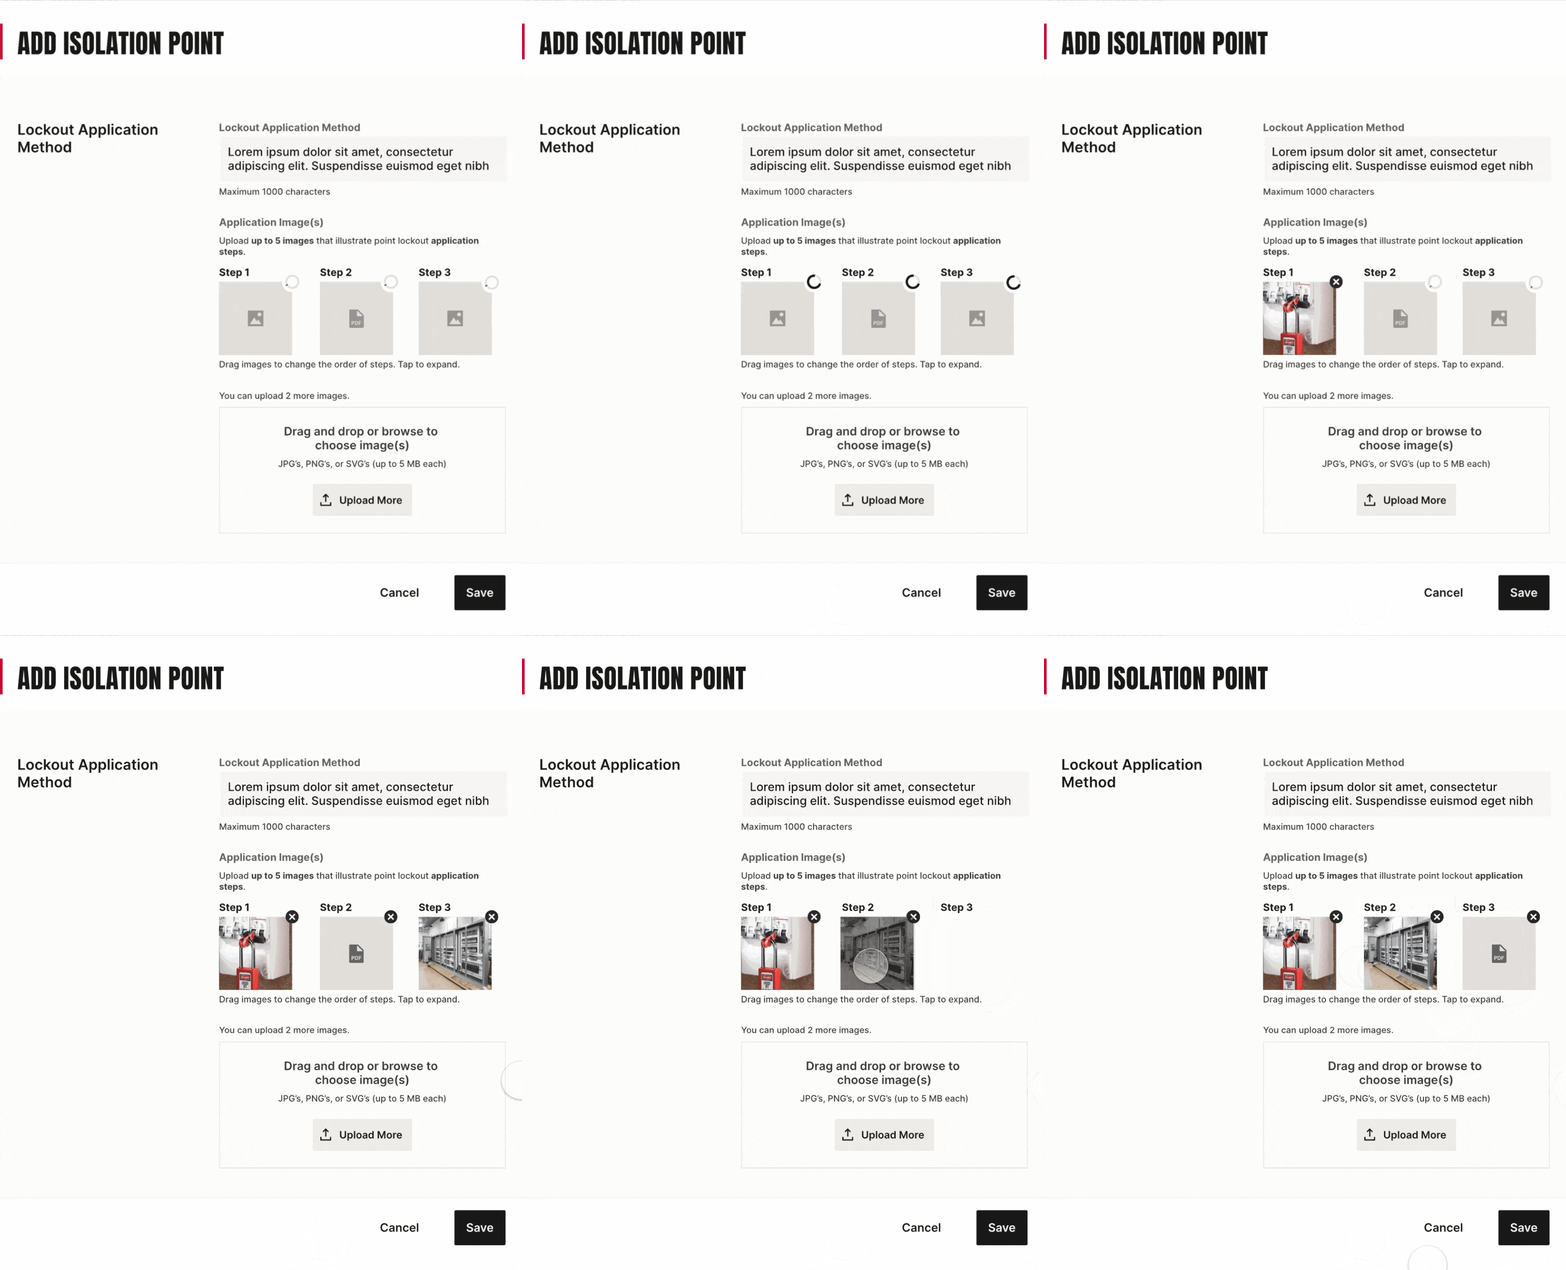
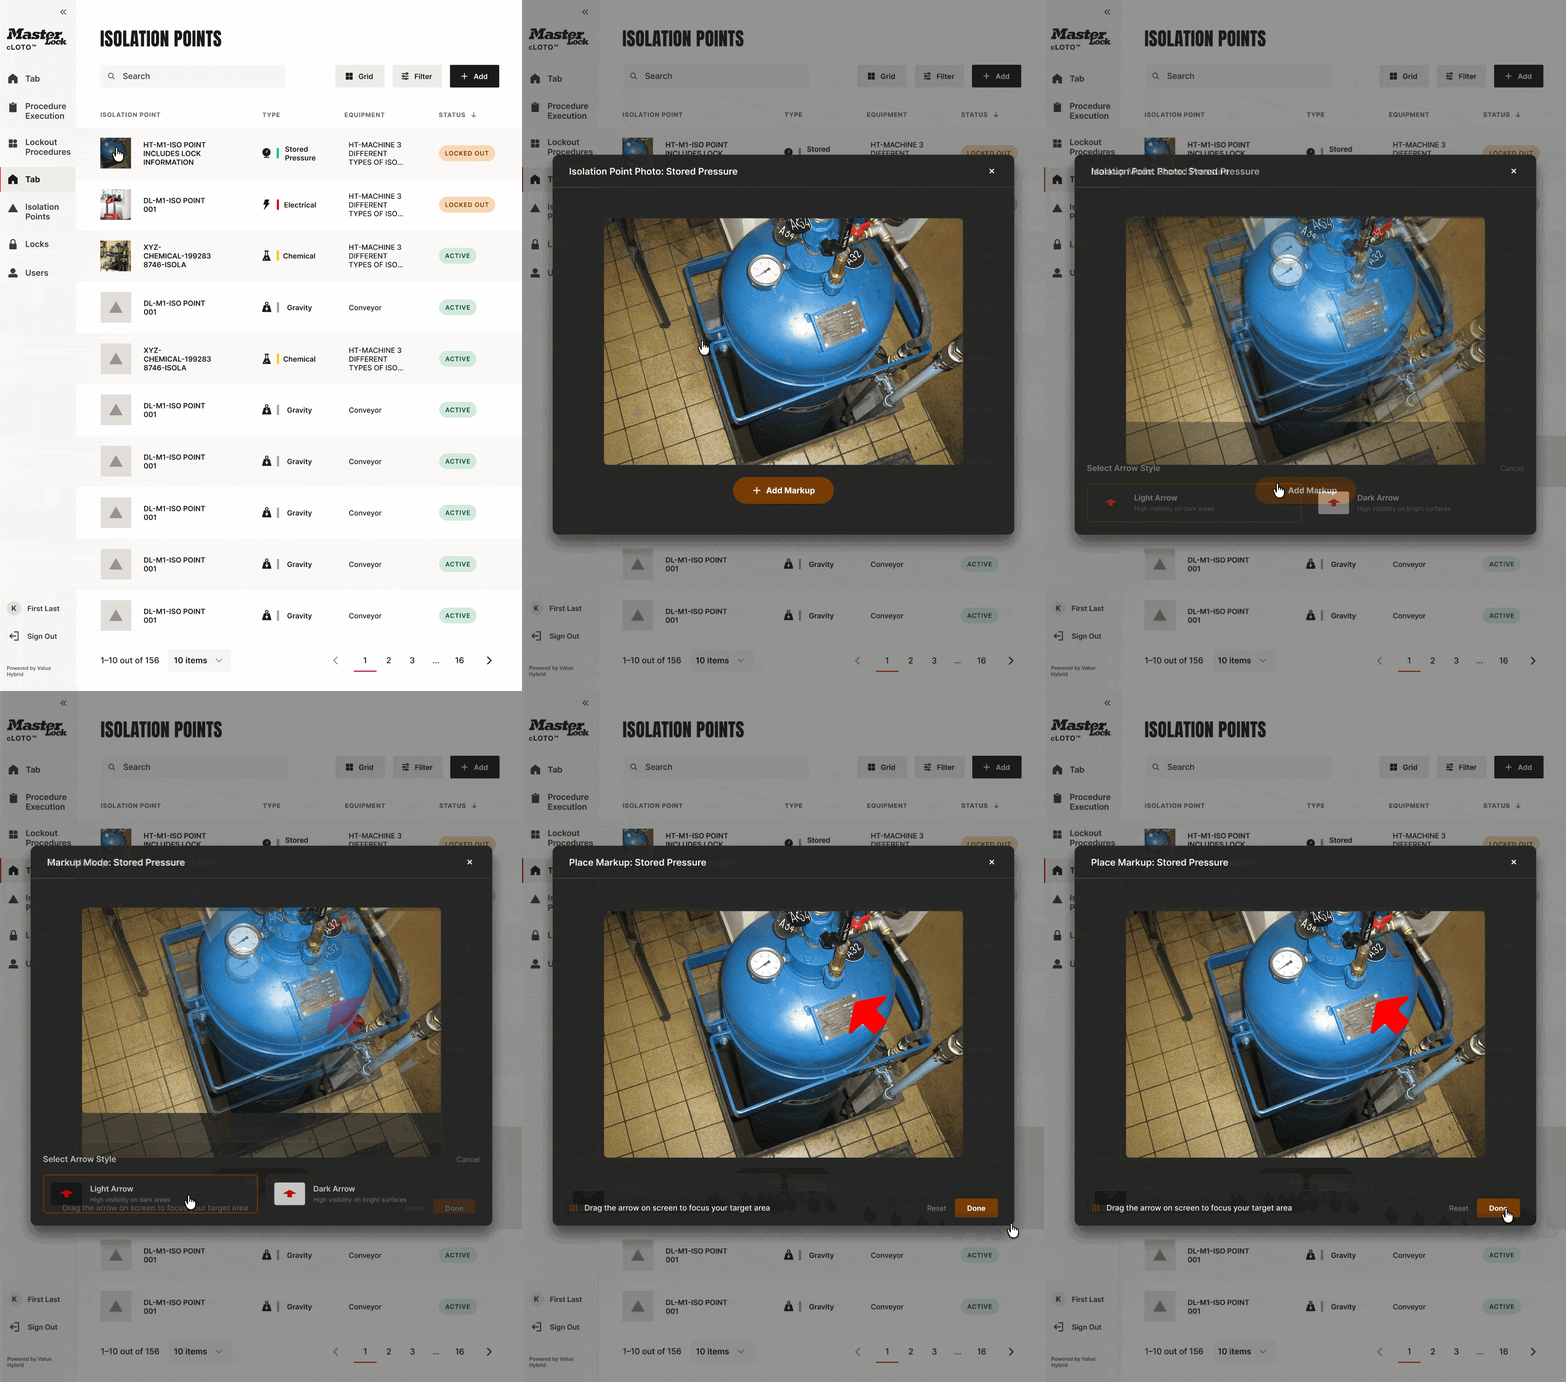
I set image size and quantity limits for reliable loading on unstable networks, then designed upload and display interactions around the lockout workflow, establishing reusable image patterns across the platform.
addressed:


solution:
Accessible with bold field colors


starting point:
Analyzing industry standards

next step:
Building the logic

result:
Lean, purposeful interactions

example:
User-informed status labels
Ability to annotate images

Customer engagement increased by 30%
Experience SUS score went from 59 to 85
100% task completion rate
Time on task decreased by 28%
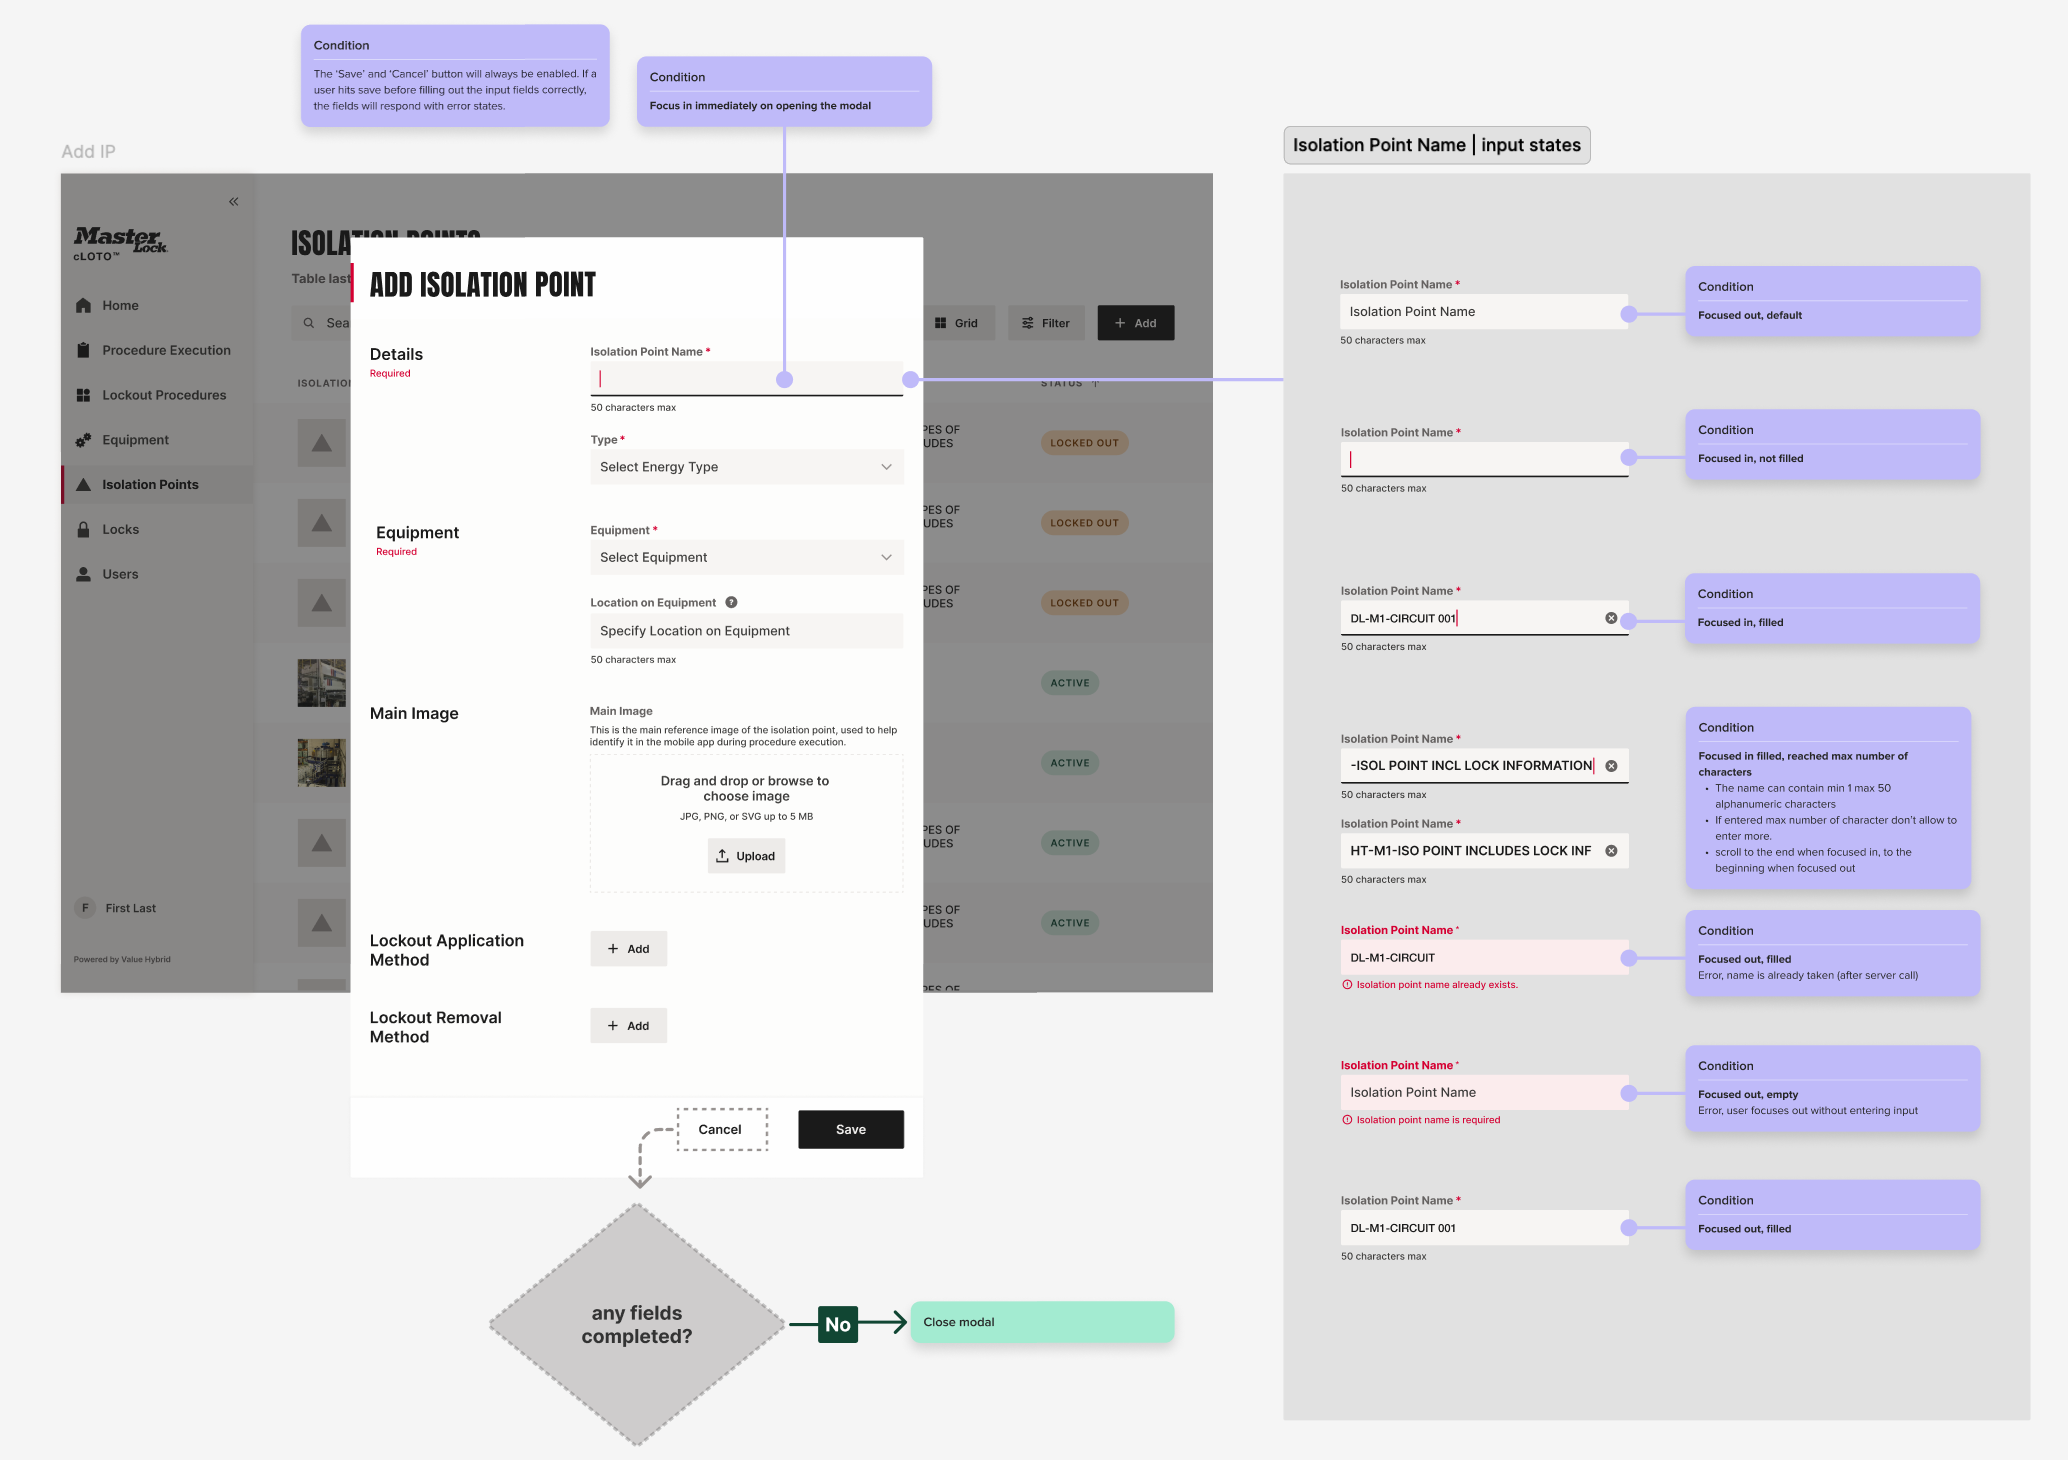
I documented every interaction, state (loading, empty, error), condition, and edge case, leaving no room for developers or QA to second-guess intent.
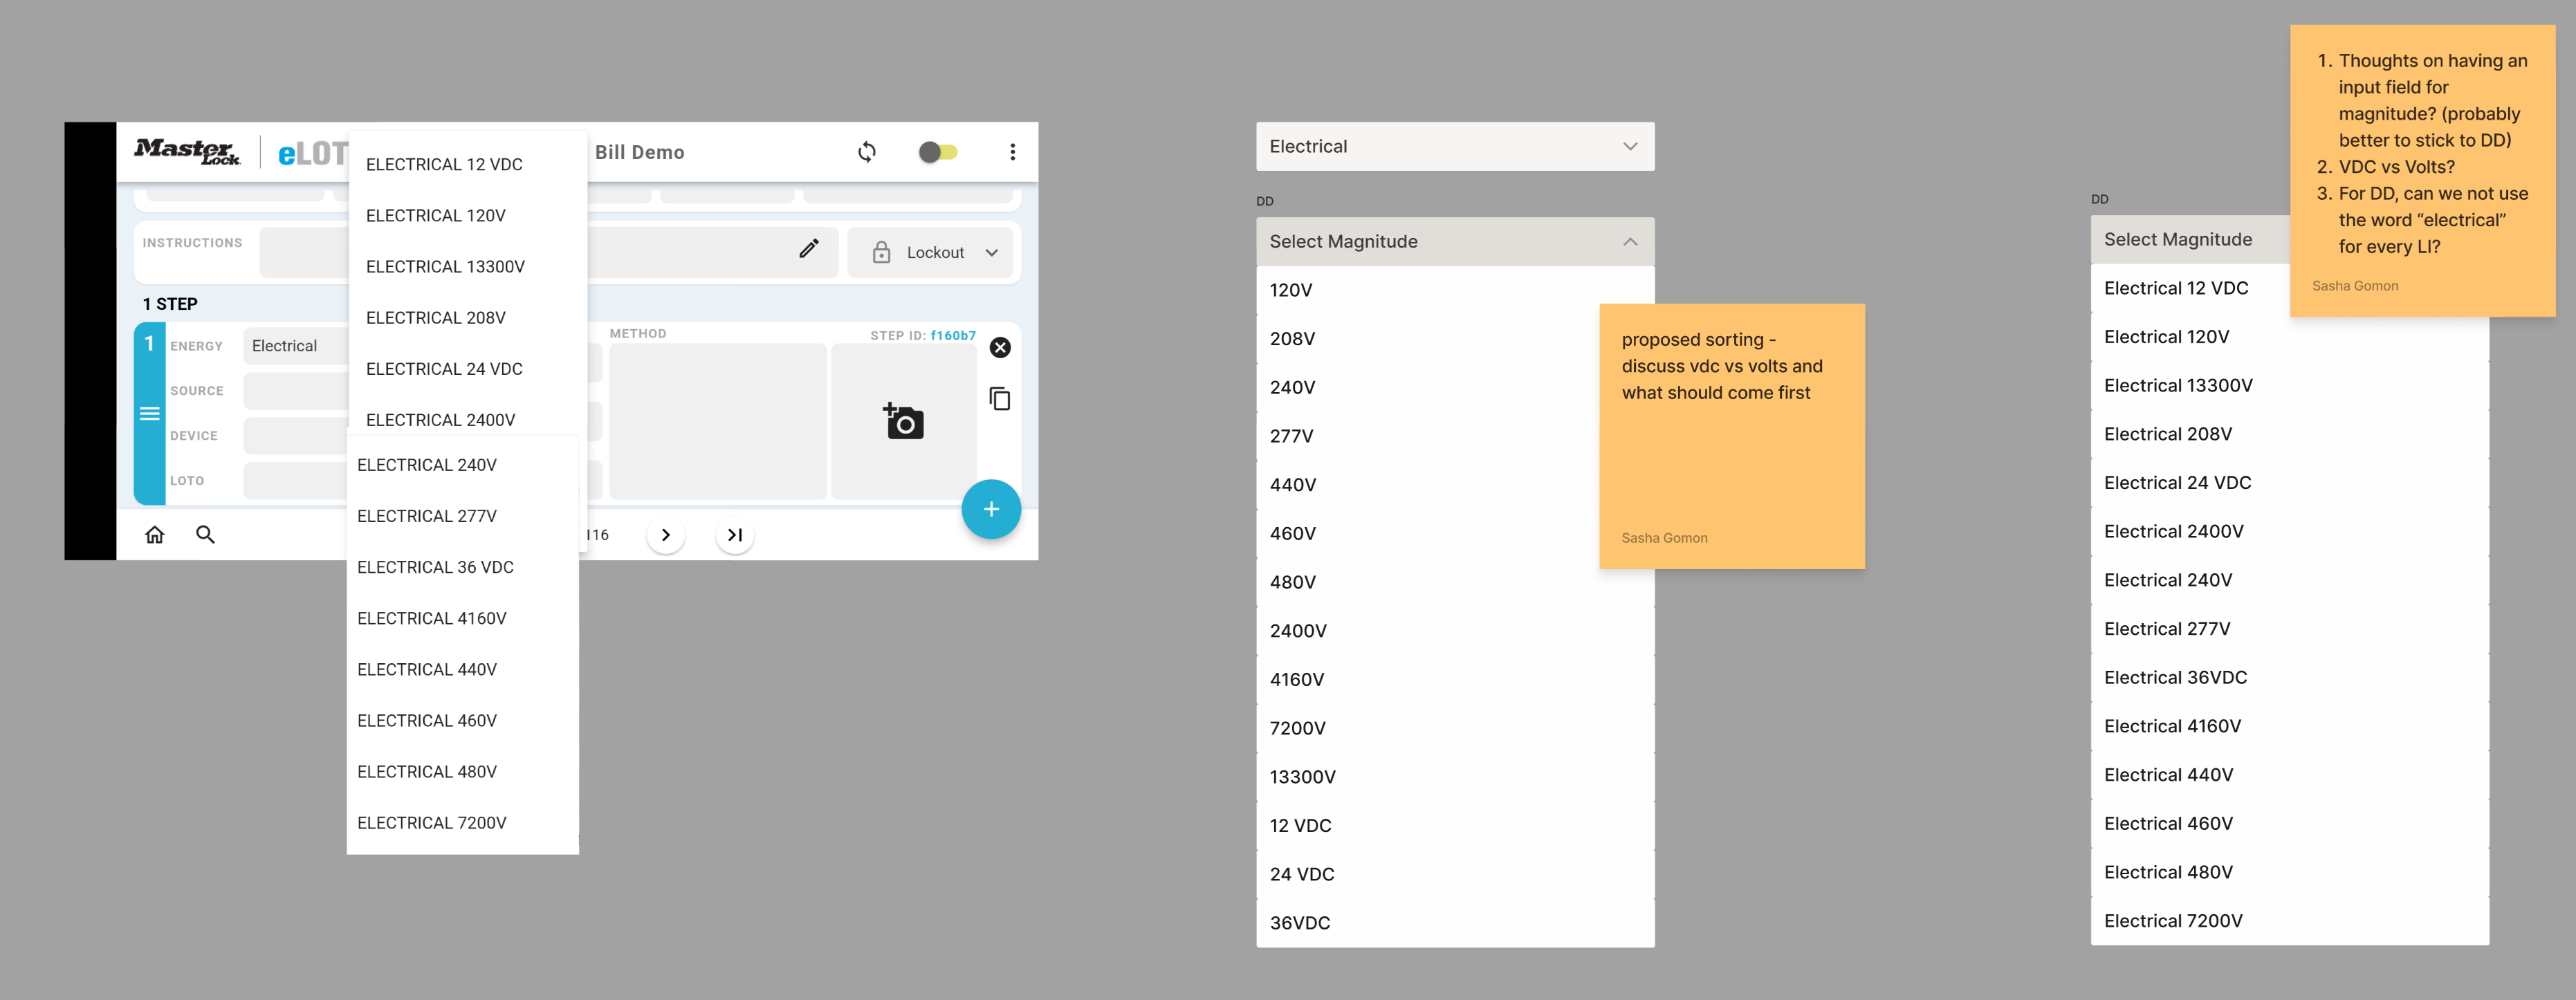
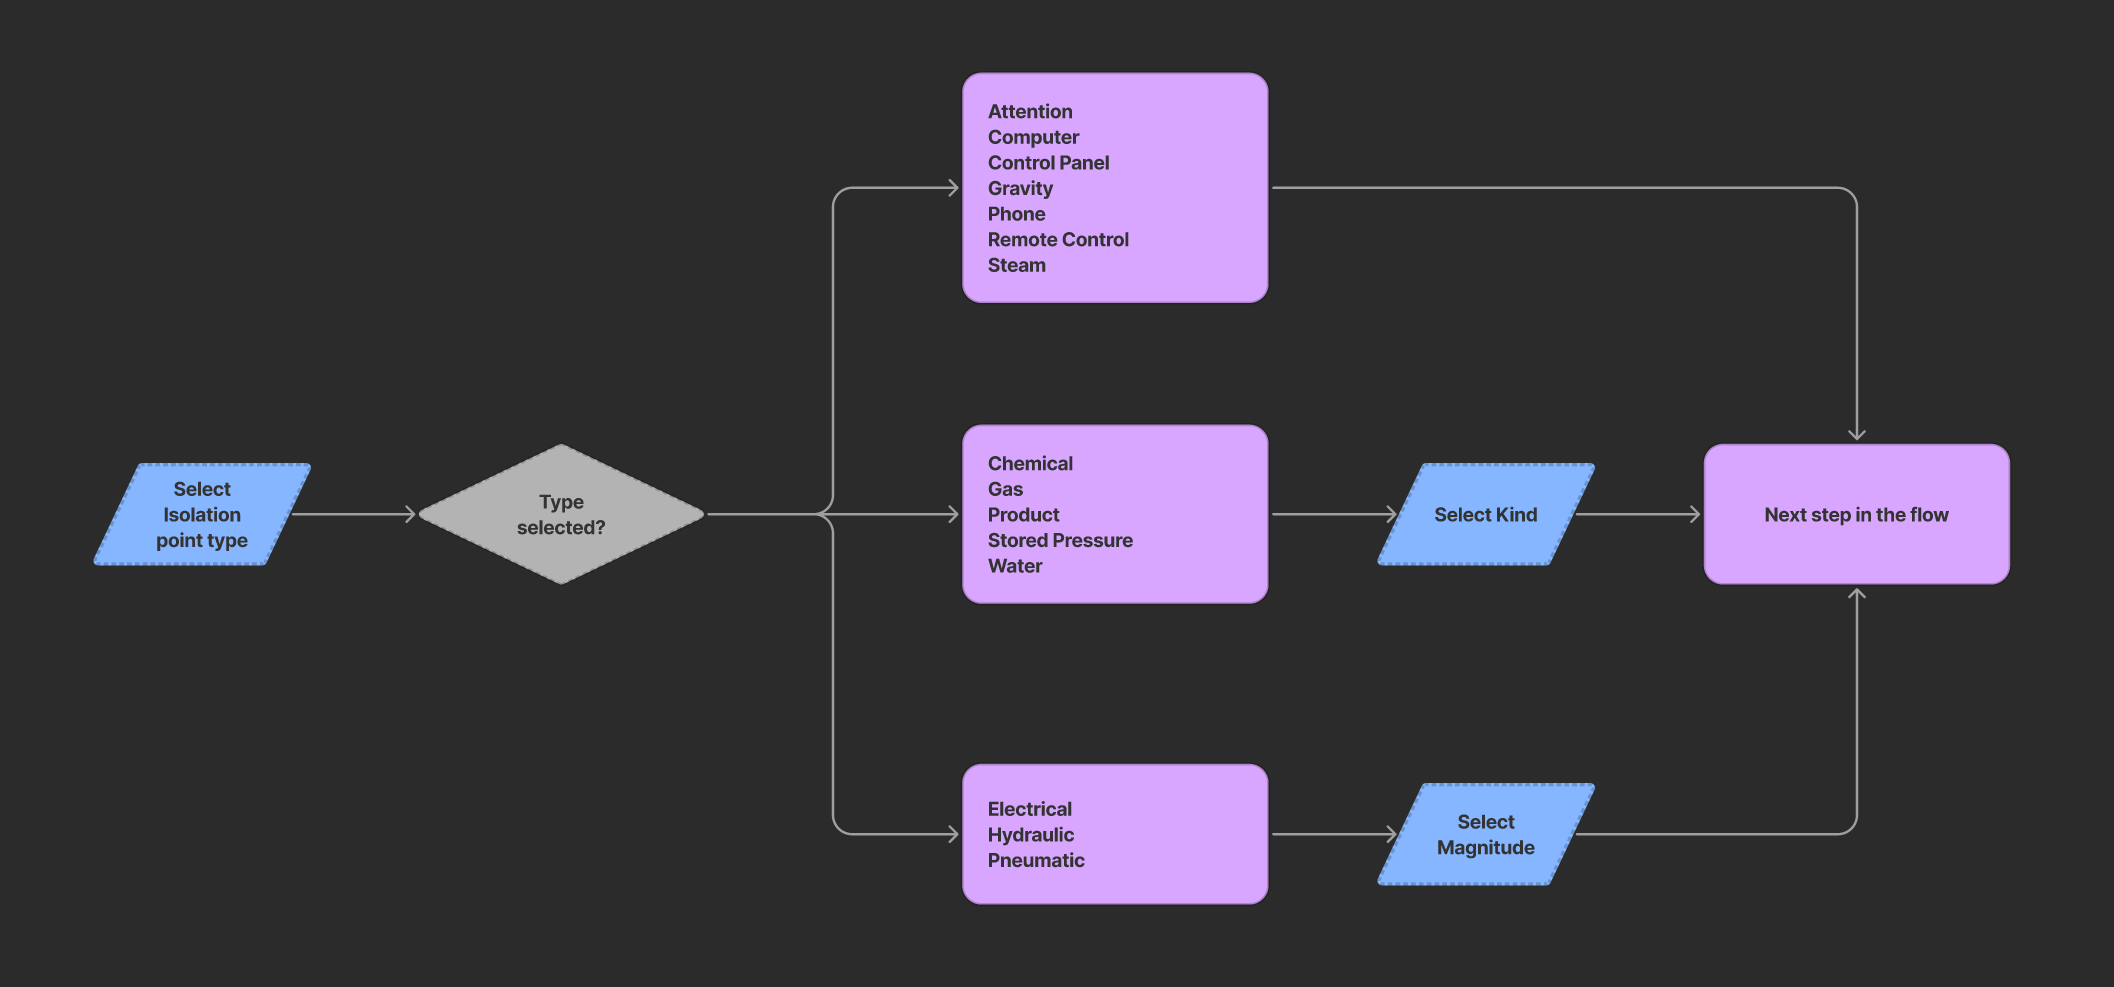
Magnitude and kind emerged during usability testing as another gap between the platform and real-world conditions. More field research upfront could have uncovered these domain-specific needs earlier and informed the initial design.